
- Ripple price sees the price consolidating between $0.50 and $0.36 on a weekly chart.
- XRP price sees RSI flat lining as lack of bulls can not provide turnaround.
- Expect to see further downward pressure as several bearish pressures are not easing.
Ripple (XRP) price came close to a full recovery after the positive shift in sentiment on Friday, but as long as price action remains below $0.50, there is still no evidence of a fundamental turnaround in sentiment. With the Relative Strength Index (RSI) flatlining and the red descending trendline not undergoing a test, investors will lose even more interest in XRP price action and trigger another exodus, with XRP price bleeding below $0.36 and a 60% loss at hand.
XRP price could go into crisis mode by losing another 60%
Ripple price is having it difficult to make ends meet in this very challenging environment. With the massive whipsaw moves this week in all markets' assets, cryptocurrencies look bleak in withstanding these waves. As XRP price closes further to the downside with no signs of recovery or at least a test on any of the price caps currently ruling, a return is nowhere near, and lack of interest further makes XRP price bleed.
XRP price is thus set for another round of corrections or a sharp nosedive move where pressure will mount again on $0.3616, where investors were able to pop back above last week. But another test could be the one too many as the baggage of geopolitical worries and moving parts in the markets become too big to process. Expect another breach below $0.3616, this time for $0.1729 to come into play, with the monthly S3 just at a $0.20 psychological level.
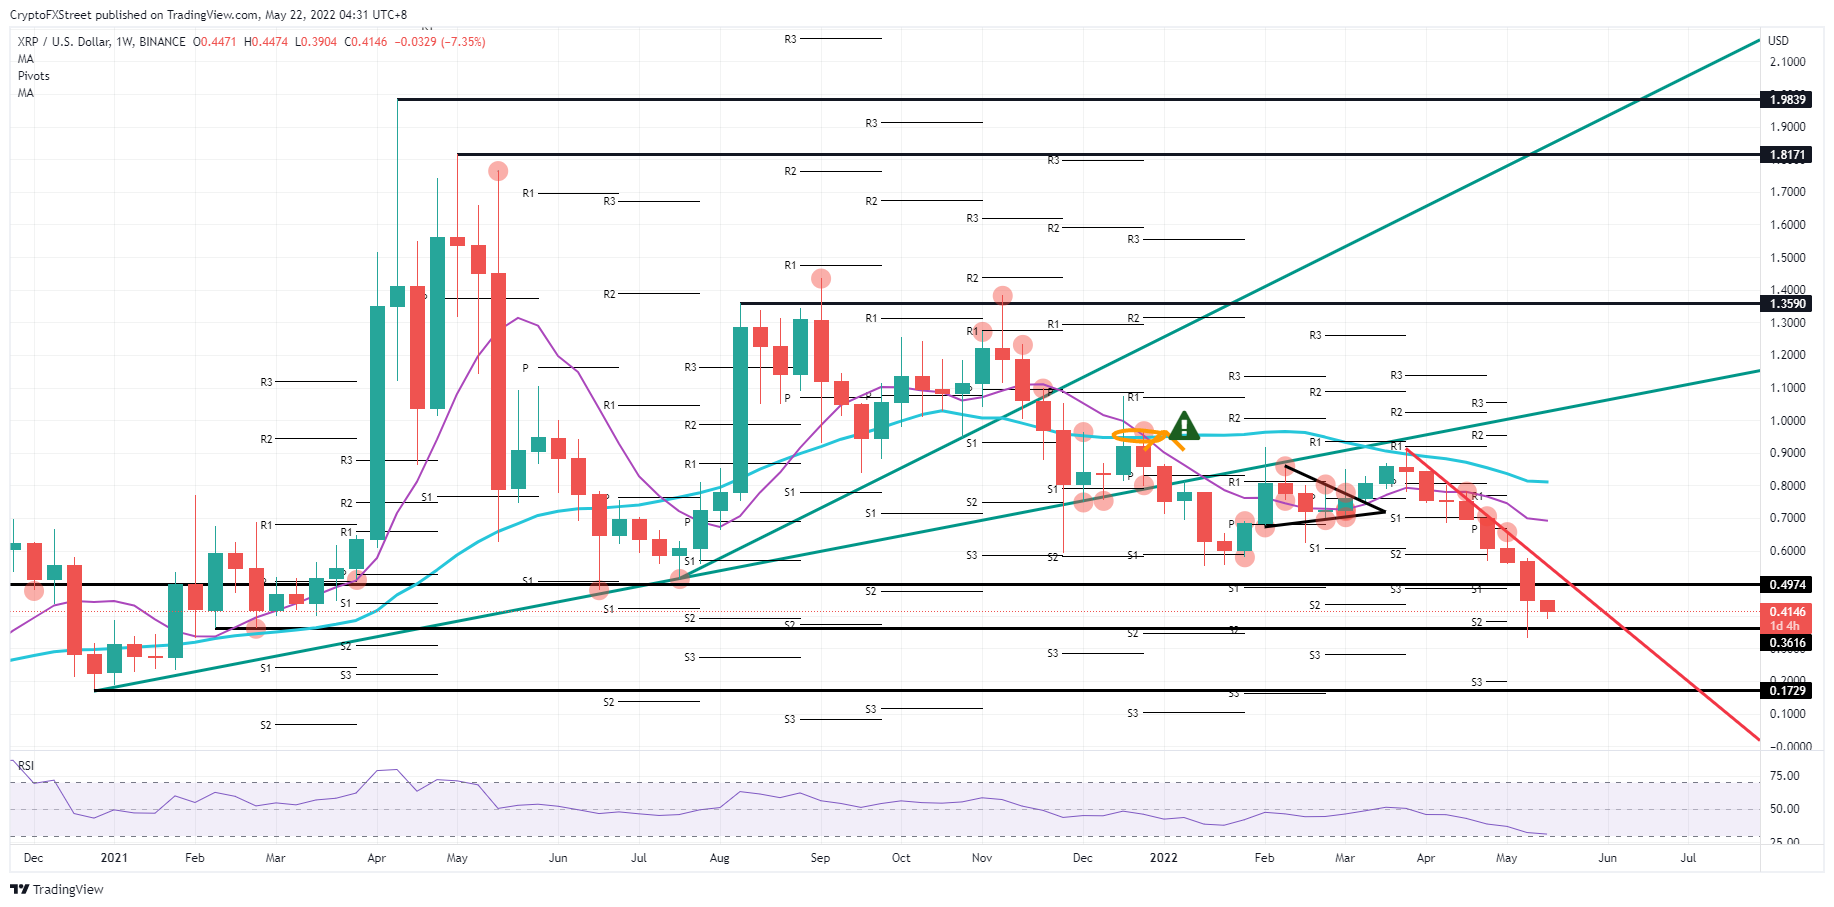
XRP/USD weekly chart
The best and ideal scenario for a U-turn move would be a weekly close above $0.4974 and a price opening on Monday in the small triangle room between that pivotal level and the red descending trend line. Bulls will use the handle as entry-level and build momentum for a breakout to the upside, piercing through that red descending trend line and triggering a massive influx of investors as finally, after weeks of sell-off, something substantial has changed. Although there are still plenty of downward forces with the death cross and the cap action of the 55-day Simple Moving Average, at least some room for more upside has been created.


