
- AUD/USD overcomes early Asian session sluggishness picks up bids of late.
- Bearish candlestick, chart pattern and Fibonacci are all trying to stop the bulls.
- Three-month-old horizontal support becomes a tough nut to crack for bears.
After an inactive start to the final day of 2021, AUD/USD traders seem to flex muscles while taking the bids to 0.7260 during the initial European morning on Friday.
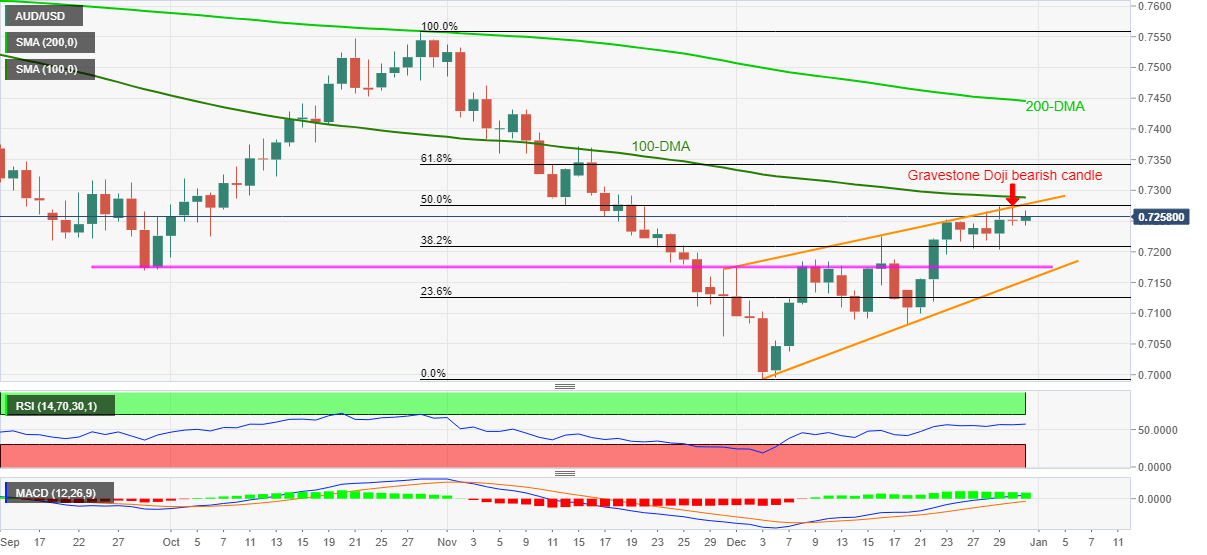
AUD/USD eased from the resistance line of a monthly rising wedge bearish chart pattern the previous day, which in turn formed a bearish candlestick called Gravestone Doji. Adding strength to the 0.7275 hurdle is the 50% Fibonacci retracement (Fibo.) of October-December downside.
Although oscillators favor an upside break of the immediate 0.7275 resistance, the 100-DMA level of 0.7290 will act as a validation point for the further rally towards the mid-November swing high of 0.7371. It’s worth noting that the RSI line is nearly overbought and hence the 0.7290 hurdle could well act as a pullback point.
If not, then the 0.7400 threshold and late October’s swing low near 0.7455 will gain the market’s attention.
Alternatively, pullback moves can retest 38.2% Fibo. level surrounding 0.7200 but a three-month-old horizontal area near 0.7175-70 will restrict any further downside.
Should the AUD/USD prices decline below 0.7170, the support line of the stated wedge around 0.7140 will be crucial to watch.
AUD/USD: Daily chart
Trend: Pullback expected


