
- Bitcoin price shot up from roughly $21,100 to $23,450 in a few hours after the FOMC announcement.
- Investors need to note that this upthrust was impressive, but it does not seem sustainable.
- A daily candlestick close above $25,000 will invalidate this bearish outlook.
Bitcoin price saw an unusual spike in buying pressure as the US Federal Reserve announced a 75 basis point hike in the Fed Funds rate. Although unsure, one could speculate that this behavior was due to the Fed’s decision meeting the population’s expectations, as well as accompanying commentary which suggested a deterioration in economic conditions and a slowdown in the pace of further hikes.
Regardless, this article tries to break down what this recent uptick means for Bitcoin and the crypto ecosystem.
Bitcoin price and the FOMC meeting
Bitcoin price has had a strong correlation with the stock market ever since the COVID crash in March 2020. As a result, events that affect the traditional markets have been playing a significant role in determining BTC’s direction.
On July 27, the FOMC meeting announced a bump of 75 basis points, which is the second consecutive interest rate hike. However, what’s interesting is that the last time this decision was made on July 13, BTC suddenly spiked to the downside and created a lower low.
The losses were offset quickly as the Bitcoin price recovered and triggered a rally. In hindsight, the swing low formed on July 13 was a local bottom that catalyzed a 28% rally for BTC and roughly 65% for Ethereum price.
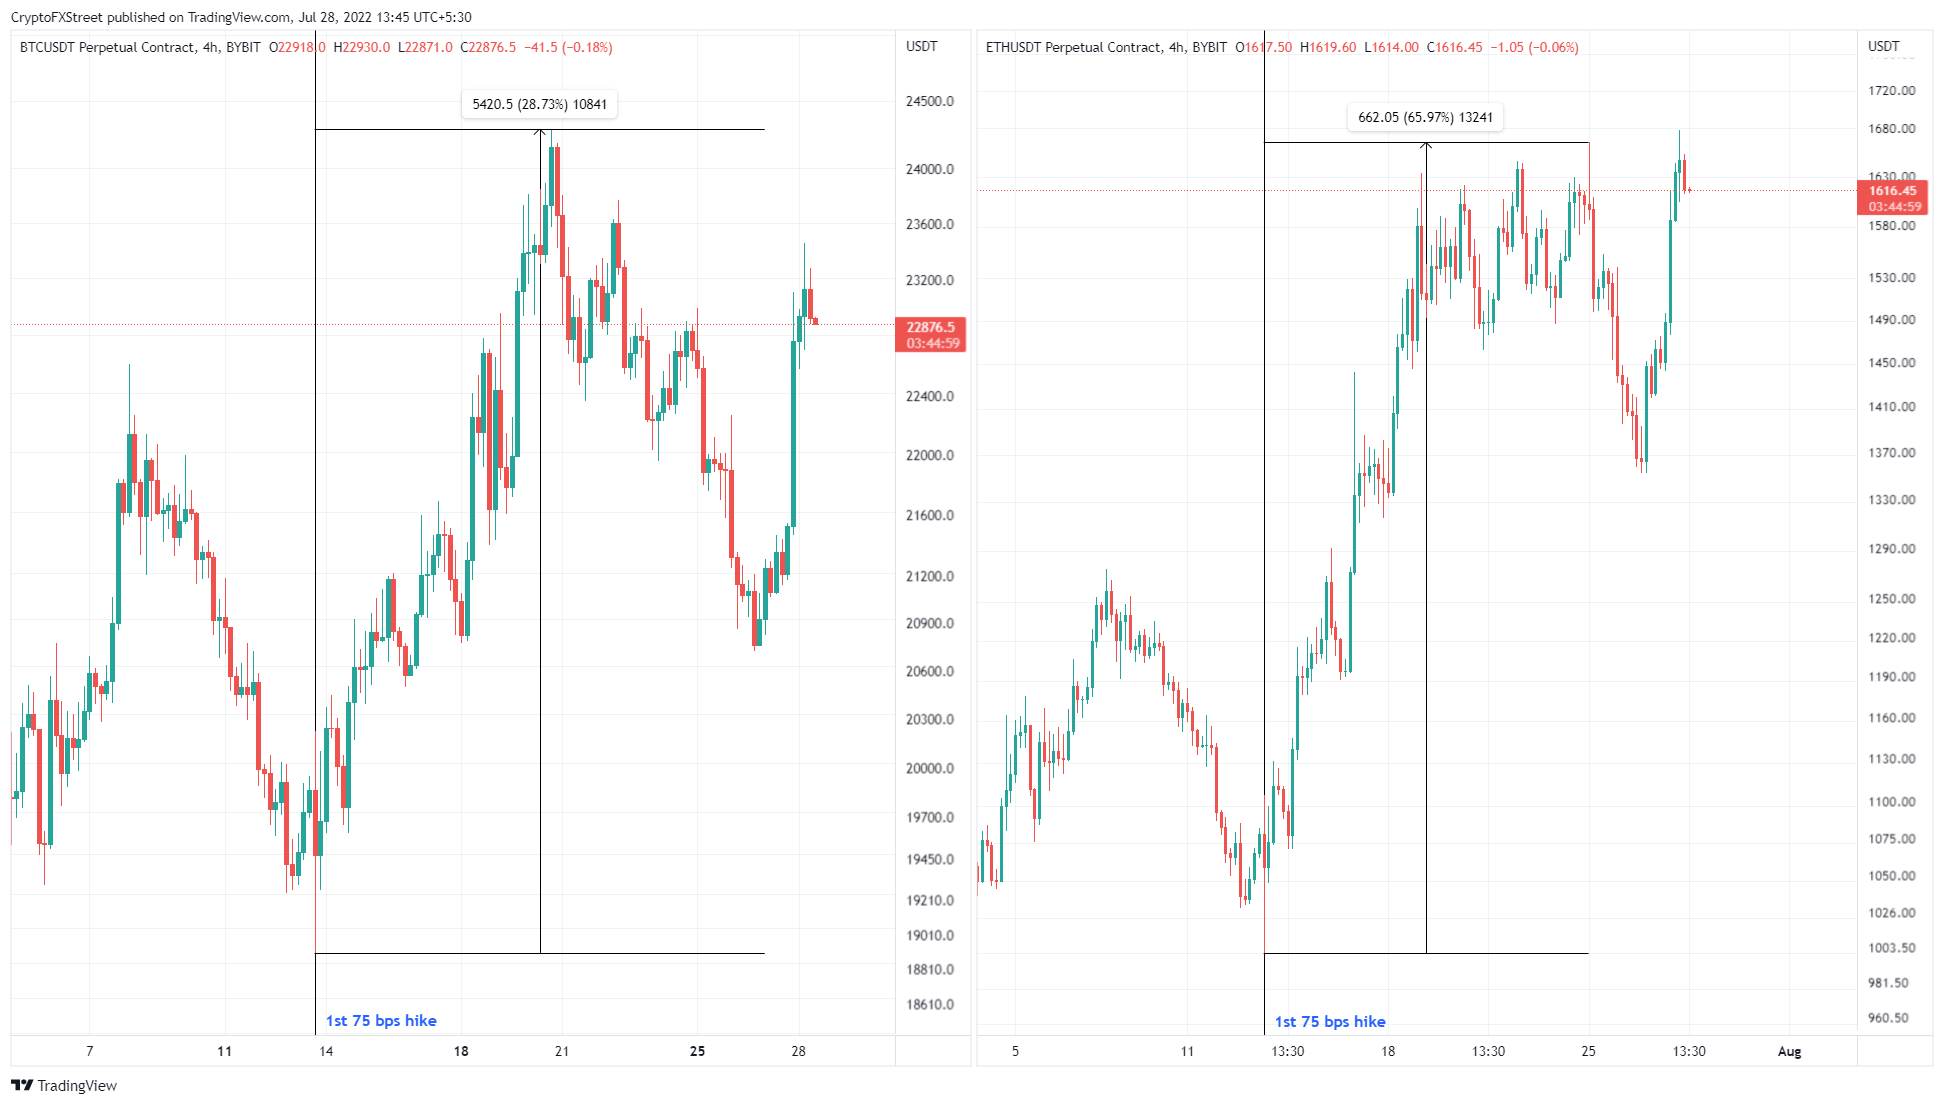
BTC and ETH vs. USDT charts
So why did BTC not crash this time?
Perhaps the most vivid difference between July 13 and July 27 is the expectations.
When the Fed announced the first 75 bps hike, the expectation of the crowd was 50 bps. Since the actual results exceeded expectations, the markets tanked briefly.
However, this time around, it was a well-known fact that the Fed was going to hike by 75 bps. Despite the fact that such a big bump in interest rates could risk recession, the results matched expectations, which could be one of the reasons why Bitcoin price triggered a run-up.
Another reason could be the commentary that accompanied the rate hike, which suggested the economy was slowing and the pace of rate hikes in the future might accordingly slow too.
The current state of Bitcoin price
Despite the bounce off of the FOMC meeting, the future still looks bearish for BTC price. As described previously, Bitcoin price seems to be forming a bear flag on the four-hour chart. This continuation pattern contains a sharp decline, the ‘flagpole’, which formed during June, ending in a ‘flag’ consolidation which formed mostly in July. The pattern forecasts a continuation of the prior downtrend once the price breaks out of the flag.
The FOMC-induced rally pushed BTC up to retest the flag highs but is likely to retrace as investors book profits.
Assuming Bitcoin price breaks below the base of the flag at $20,603, the theoretical method for forecasting a target suggests a subsequent move down to $11,717. This level is obtained by adding the flagpole’s height to the breakout point.
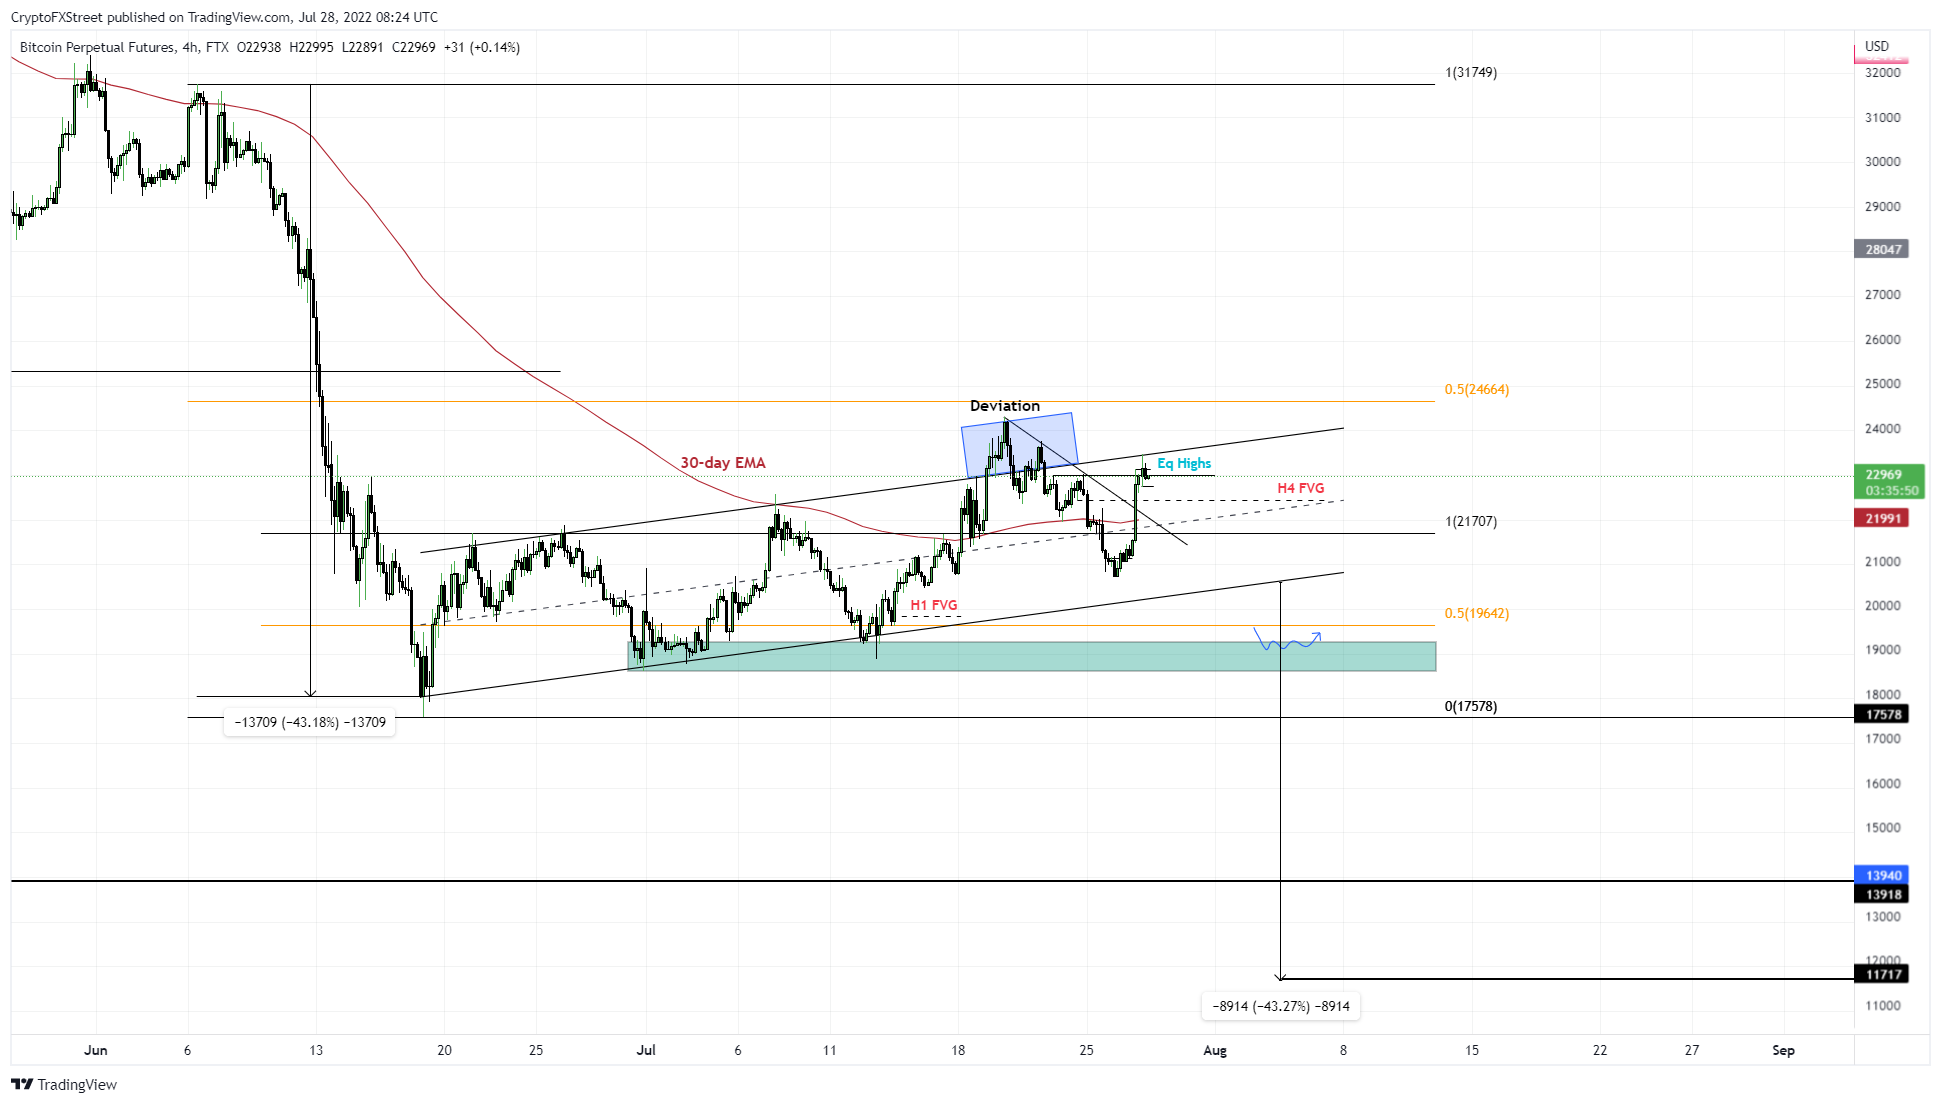
BTC/USDT 4-hour chart
While investors need to be cautious of this rally, they should also be aware that it also has the potential to extend higher, if certain resistance levels are breached. In this case, if the Bitcoin price produces a daily candlestick close above $25,000 it will invalidate the bear flag scenario, and suggest a potential reversal in the trend leading to higher prices.


