
- Bitcoin price auctions just below an Elliot Wave trend channel established in 2019.
- BTC price shows bullish divergence between Wave 2 and Wave 4 on the Relative Strength Index.
- Invalidation of the macro thesis is a breach of Wave 1 at $13,880.
Bitcoin price is still very bullish according to macro technicals. A modest $80,000 target is still in the cards for the future, but defining a market bottom remains the true challenge. MicroStrategy CEO Michael Saylor stands by a similar bullish bias.
Bitcoin price is unfazed on larger time frames
Bitcoin price has traders in a frenzy this week as the bears have managed to suppress the price below the psychological $20,000 barrier. While many day traders see no hope for the peer-to-peer digital currency, the current selloff is still viewed as a discounted price amongst long-term investors such as MicroStrategy CEO, Michael Saylor. According to Saylor, Bitcoin is supremely undervalued and “it is only a matter of time before the world finally realizes" the importance of a non-inflated peer-to-peer digital currency.
Bitcoin price, at the time of writing, trades at $19,340. Historically, Bitcoin has never spent more than one month within the $19,000 region. In December 2017, BTC price traded briefly near the $19,000 level before plummeting to $3,850 during the Coronavirus pandemic. BTC price spent just a short period of four weeks within the $19,000 region during November 2020 before rallying into the 2021 high at $64,895.
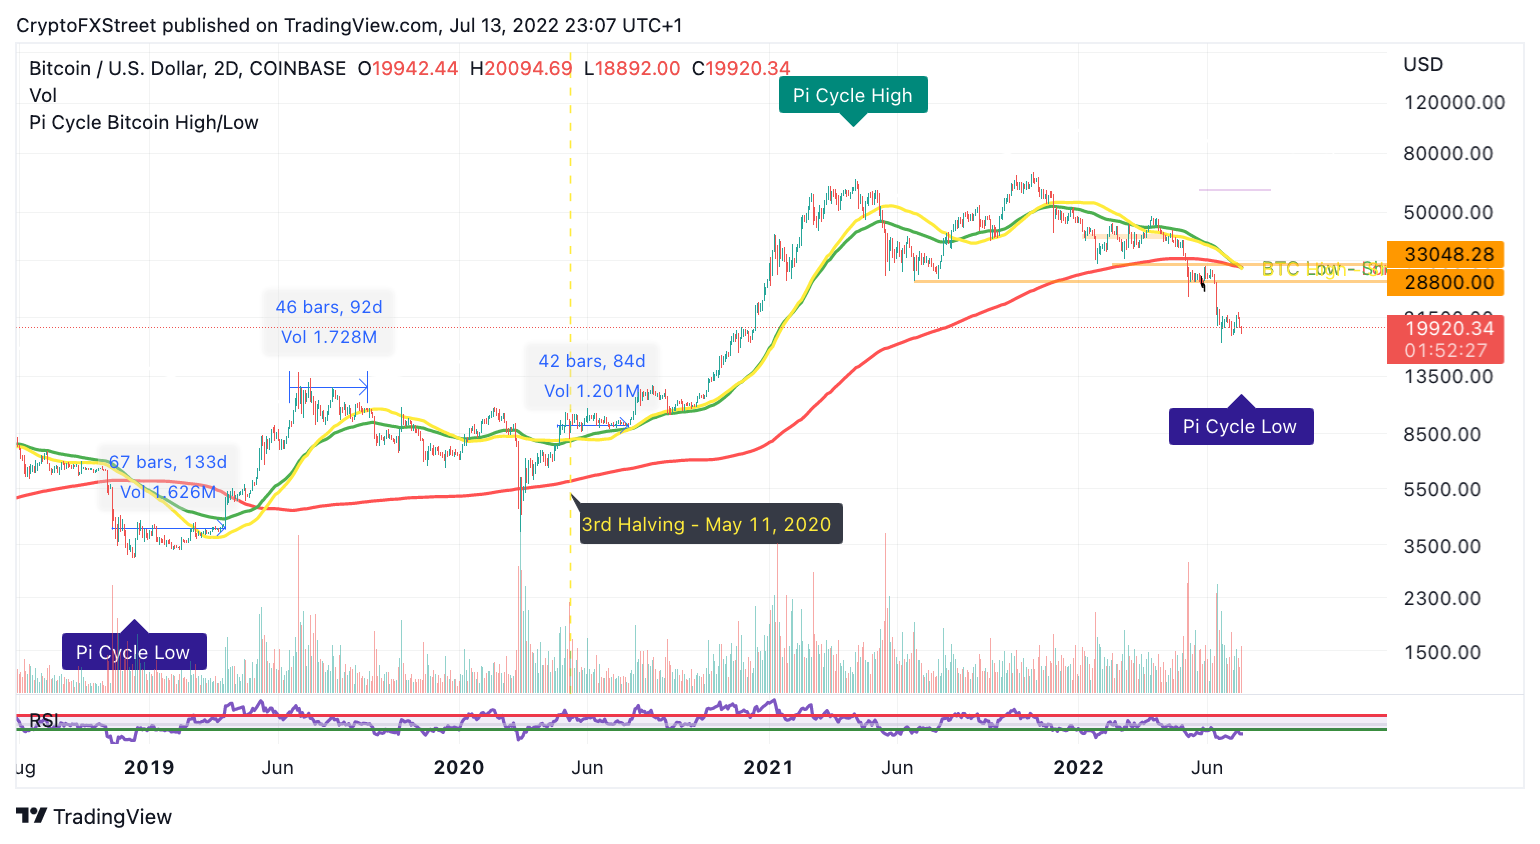
BTC/USD 2-Day Chart
What is Bitcoin trying to tell us?
The $19,000 level can be viewed as a barrier to entry. Smart money does not spend much time in the region before sharp advances occur. Thus, traders may need to pick sides soon. Are you a bull or a bear?
Bitcoin price hovers just below an Elliot Wave parallel trend channel for the third week in a row. Early evidence of a market bottom could be a breach and close above the channel currently positioned at $21,222.
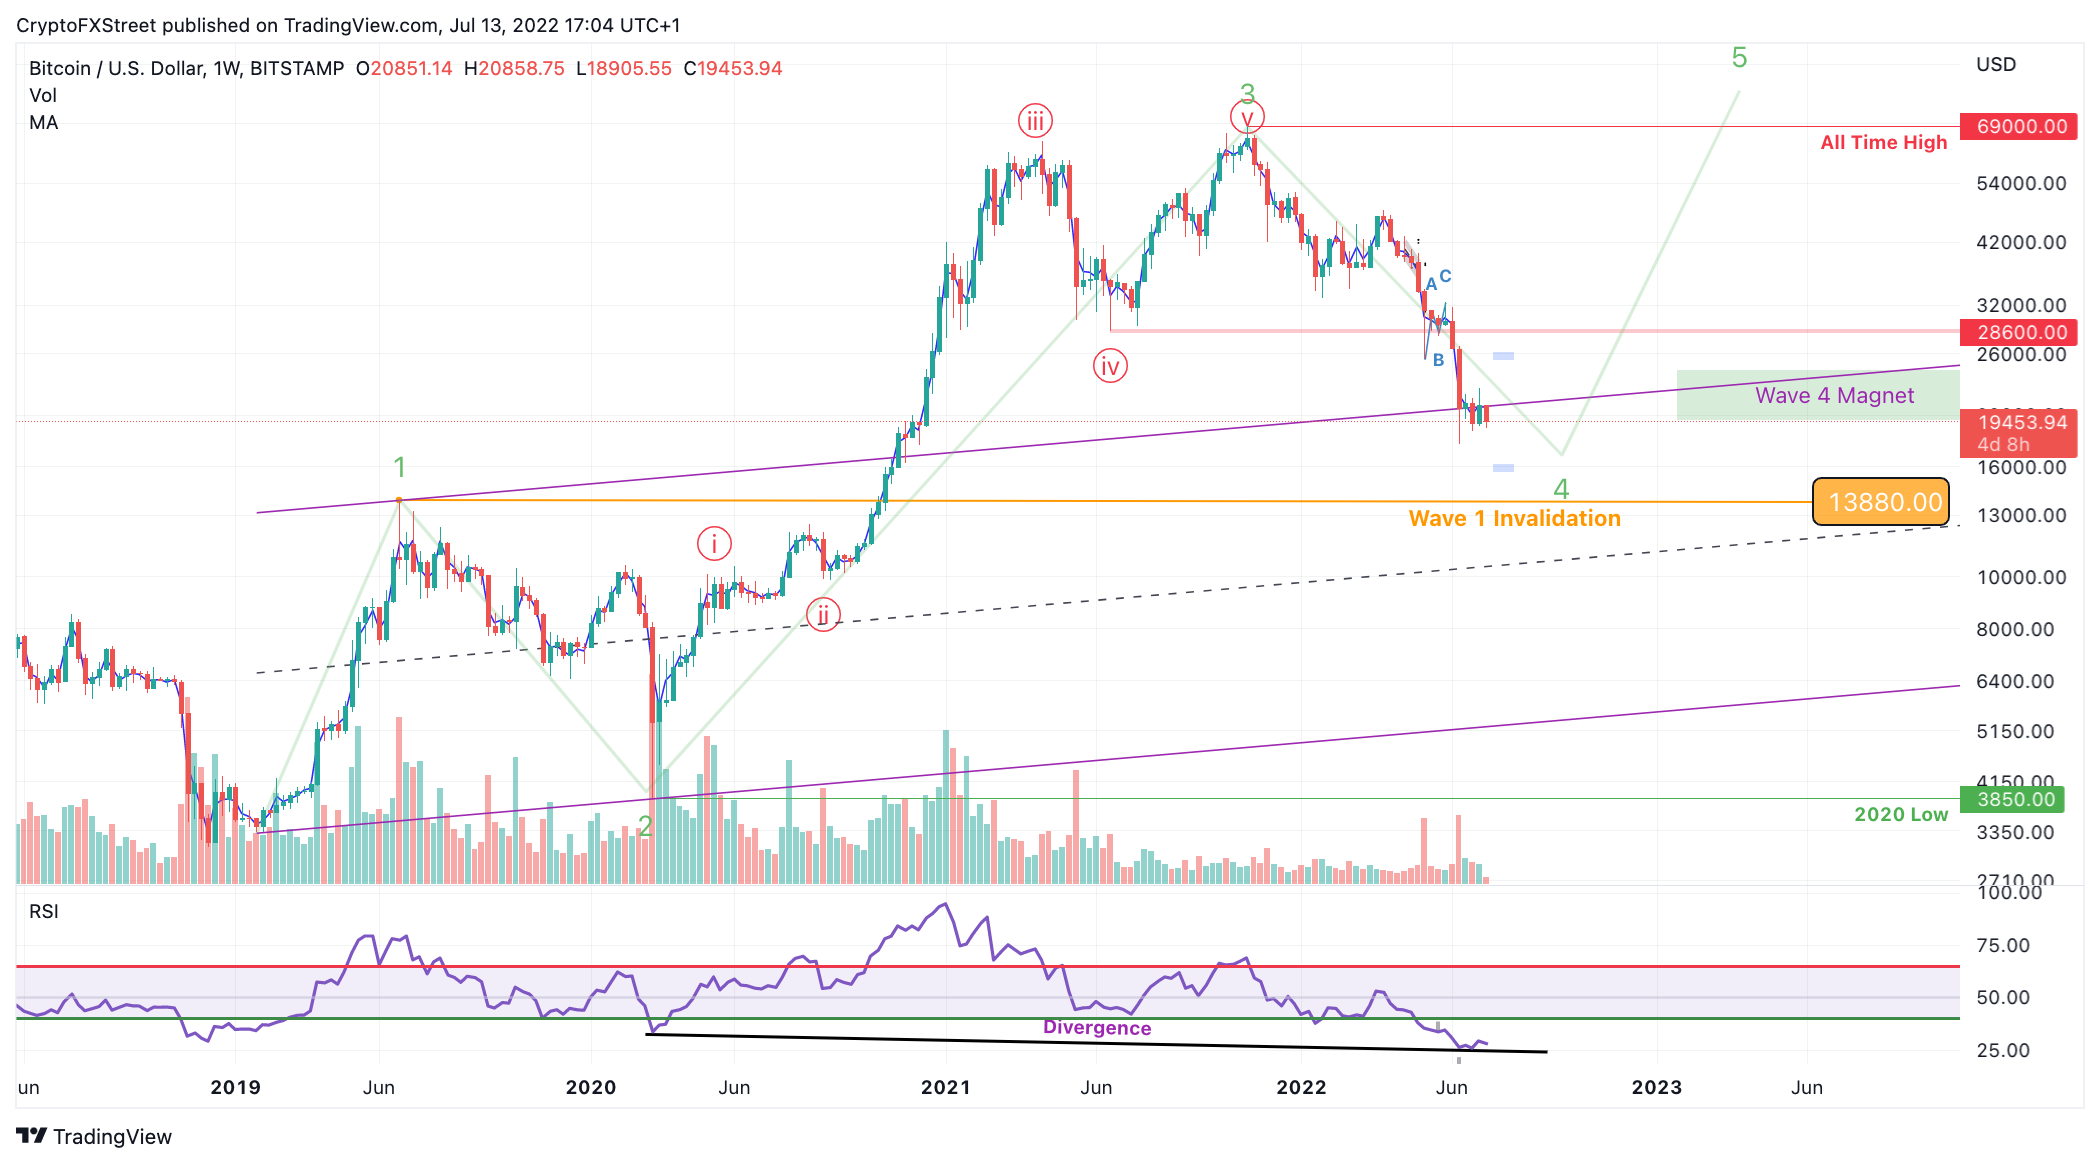
BTC/USDT 1-Week Chart
From an Elliot Wave perspective, the Bitcoin price still has a chance of becoming Michael Saylor’s Elixir. The Relative Strength Index (RSI) confounds the Elliott Wave's bullish thesis on weekly and daily time frames. Notice the bullish divergence between Wave 2 at $3,875 and the current price level at $19,400. The RSI suggests Bitcoin's current value at $19,400 is more oversold than when the Bitcoin price traded at $3,850 during the pandemic lows of 2020.
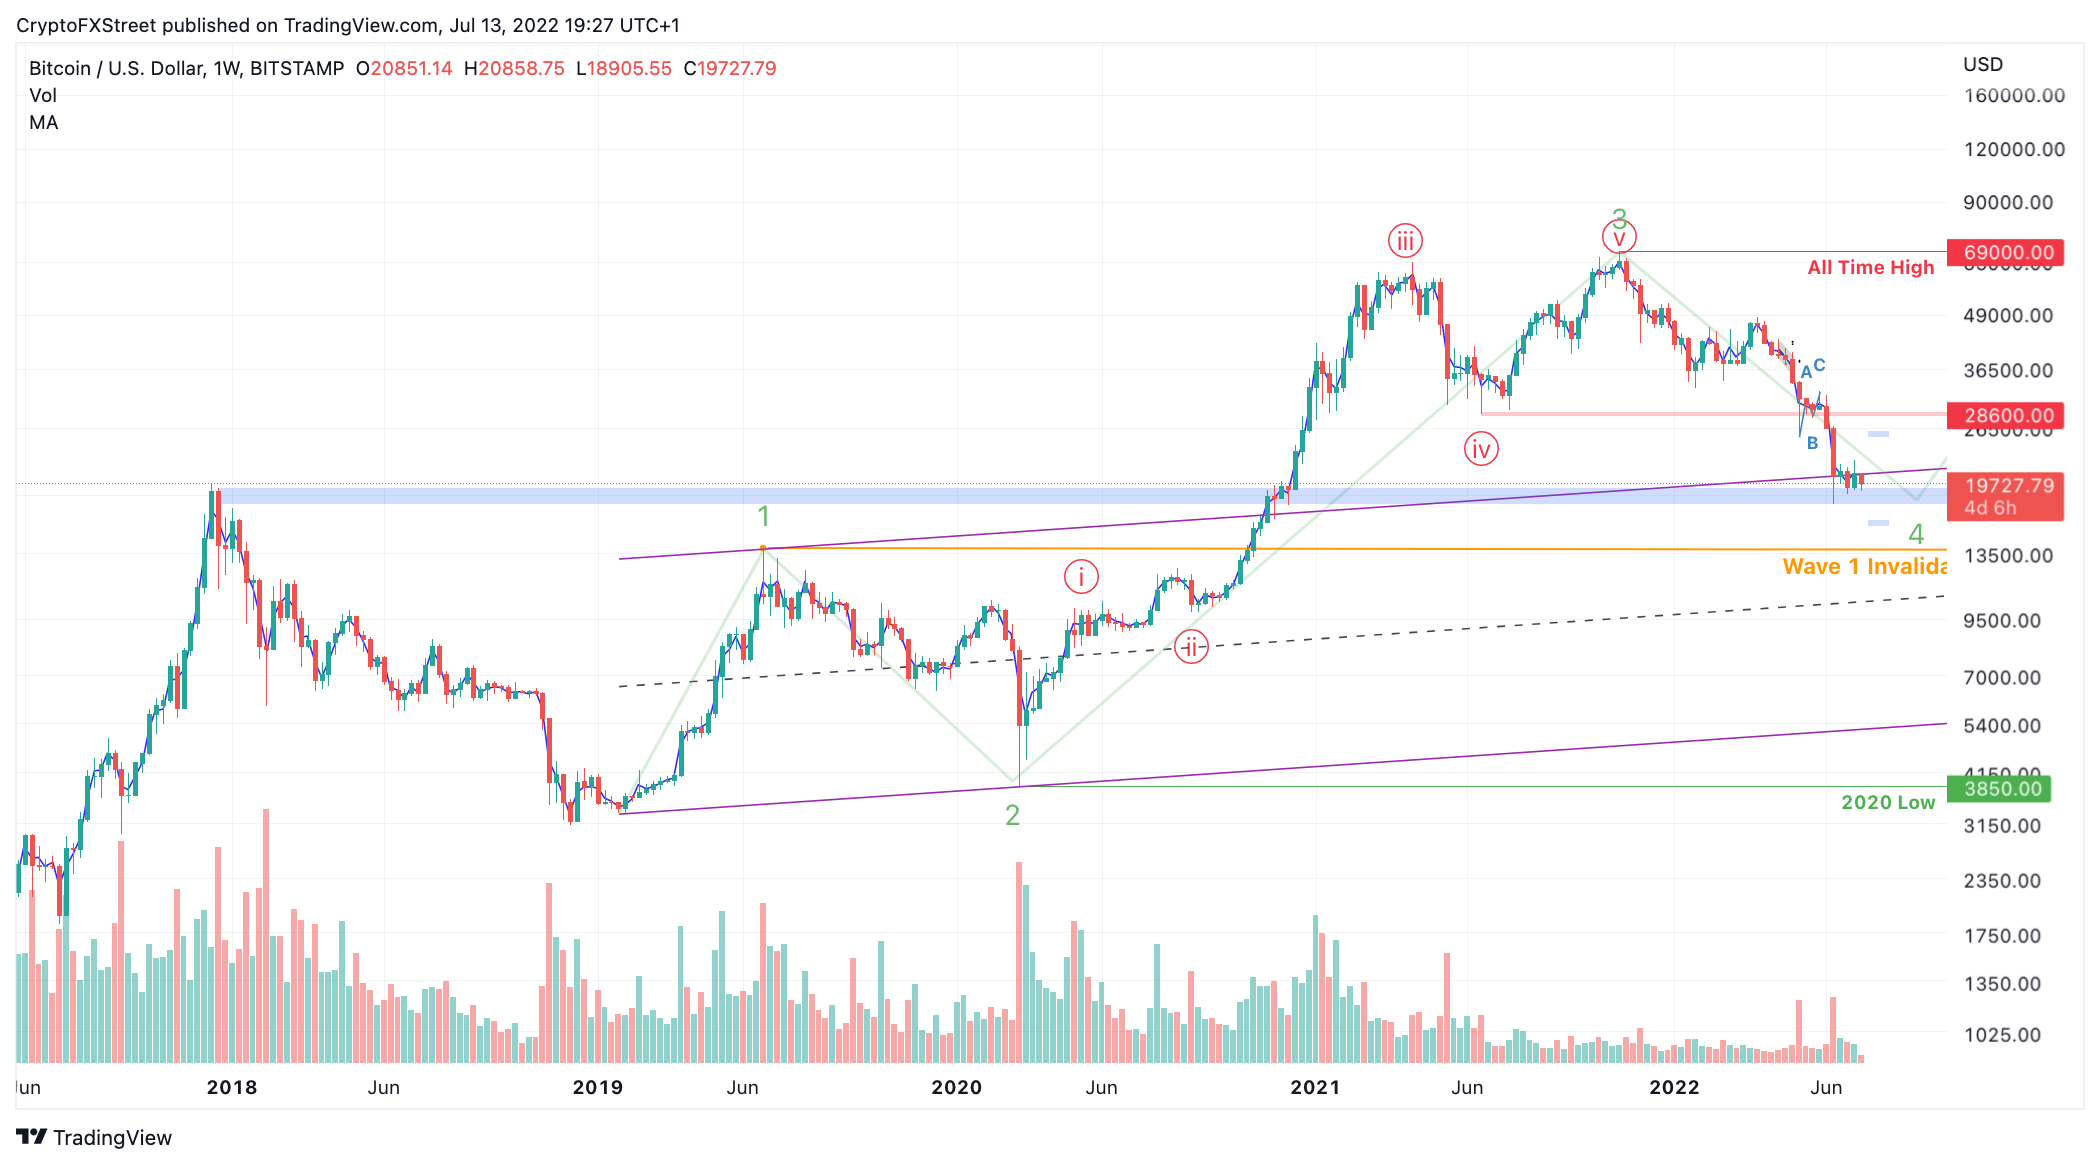
BTC/USDT 1-Week Chart
If Bitcoin is indeed auctioned in a time-consuming Wave 4, then there is still a chance for a future Wave 5 bull run in the future. Conservative targets would be the all-time highs at $69,000. There are multiple reasons to believe in an $80,000 target, but this thesis is not intended to be a fantasy/FUD post.
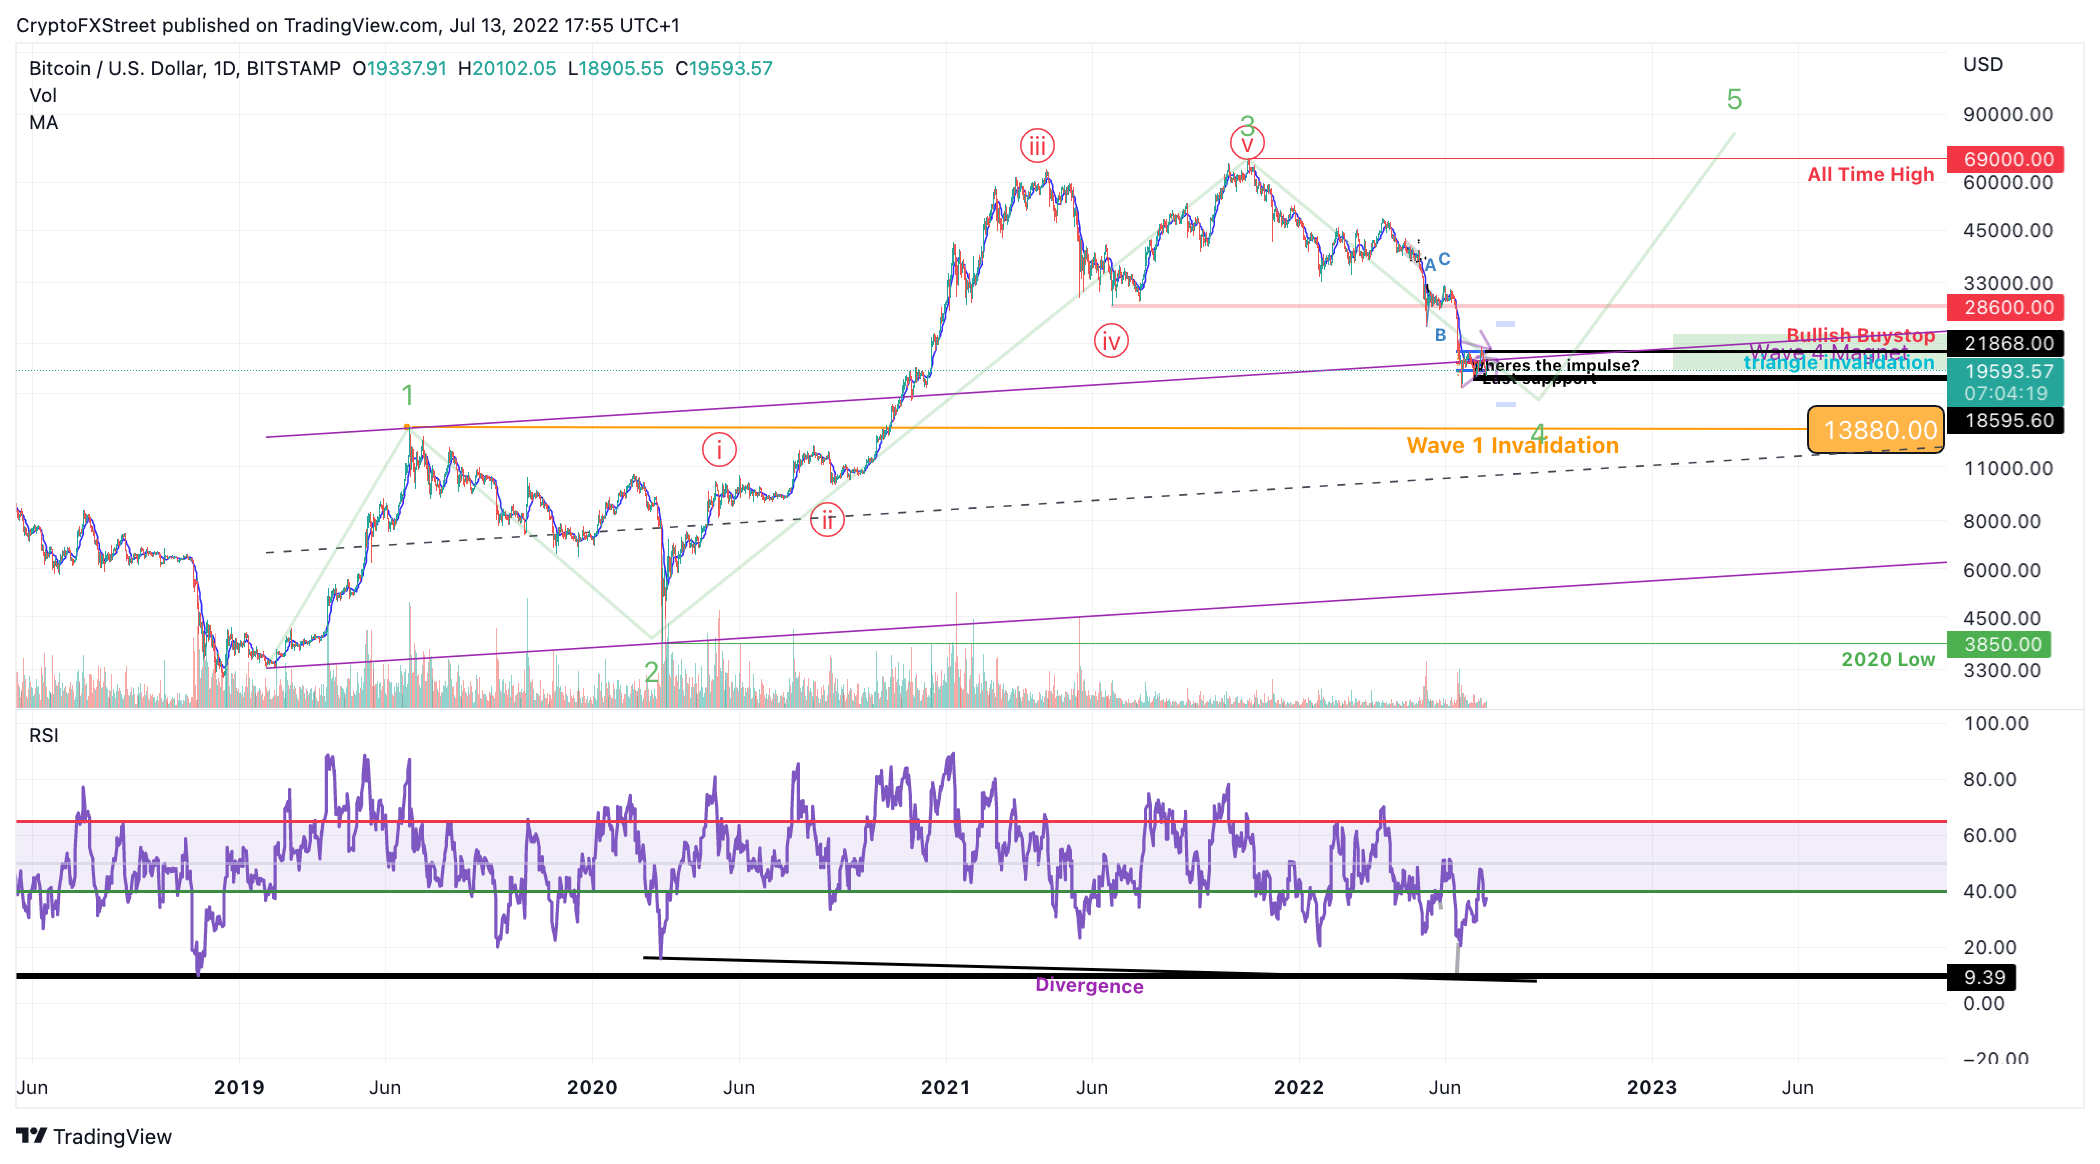
BTC/USDT 1-Day Chart
Invalidation of the bullish macro thesis remains Wave 1 at $13,880. If $13,880 is breached, cryptocurrency will likely be in a bear market for years to come. The bears should have the strength to likely grab liquidity under CME gaps at $10,000. Additionally, they could potentially liquidate the pandemic lows at $3,850, resulting in an 80% decline from the current Bitcoin price.


