
- Bitcoin price has surprisingly remained in a lull despite this week’s astonishing rate of adoption.
- From indexes to Micro BTC futures, the fundamental nature of the flagship cryptocurrency has grown.
- Multiple on-chain indicators hint at an incoming price explosion.
Bitcoin price faces a stiff resistance wall that has prevented weak bullish momentum from passing through. As a result, a short-lived retracement has caused a majority of the market to follow suit despite BTC’s raging adoption and interest from institutions over the past week.
Slowly, then all at once
Perhaps the most significant development surrounding Bitcoin over the past week was the introduction of Bitcoin, Ether and Cryptocurrency MegaCap indexes by S&P Dow Jones Indices.
While Bitcoin and Ethereum may be the first cryptocurrencies to get their indexes listed in the traditional form, the firm’s global head of innovation, Peter Roffman, mentioned that other digital assets meeting their criteria would follow.
He stated,
“We want to pick the coins that have the largest institutional following.”
Not only is S&P Dow Jones bringing Bitcoin to Wall Street, but Stone Ridge and its subsidiaries FIS and NYDIG are set to offer the pioneer cryptocurrency to the retail end of the market. FIS’s Digital One Mobile tool will allow banks’ customers to manage their Bitcoin trading services, while NYDIG will provide them with a secure custodial and trading platform.
Along the same lines, the Chicago Mercantile Exchange (CME) is trying to serve a wider audience by launching Micro Bitcoin Futures (MBF) contracts after its BTC offerings were a hit among institutional investors.
While demand continues rising, Goldman Sachs also announced that it will join the Bitcoin craze. The multinational investment bank is launching BTC Non-Deliverable Forwards (NDF), which are a form of derivatives contracts that track BTC price. This institution-faced investment vehicle will allow high-net-worth players to dabble in cryptocurrencies without the risk of actually holding the underlying asset.
Bitcoin price coils up
Despite the growing interest for Bitcoin among institutional investors, its price has remained stagnant. The daily chart shows Bitcoin price has failed to slice through the immediate supply zone that extends from $56,065 to $57,965. The inability of buyers to push it further up has caused the bears to take partial control.
For this reason, only a daily candlestick close above the aforementioned resistance area will signal a resurgence of buyers, which could potentially kick-start a new uptrend. But the bulls face another supply zone that stretches from $59,675 to $61,000.
Shattering these two levels of resistance will set the precedent for Bitcoin price to retest its all-time high at $64,895 and perhaps enter price discovery mode. In such a case, the 161.8% Fibonacci extension level at $68,840 will be a likely target.
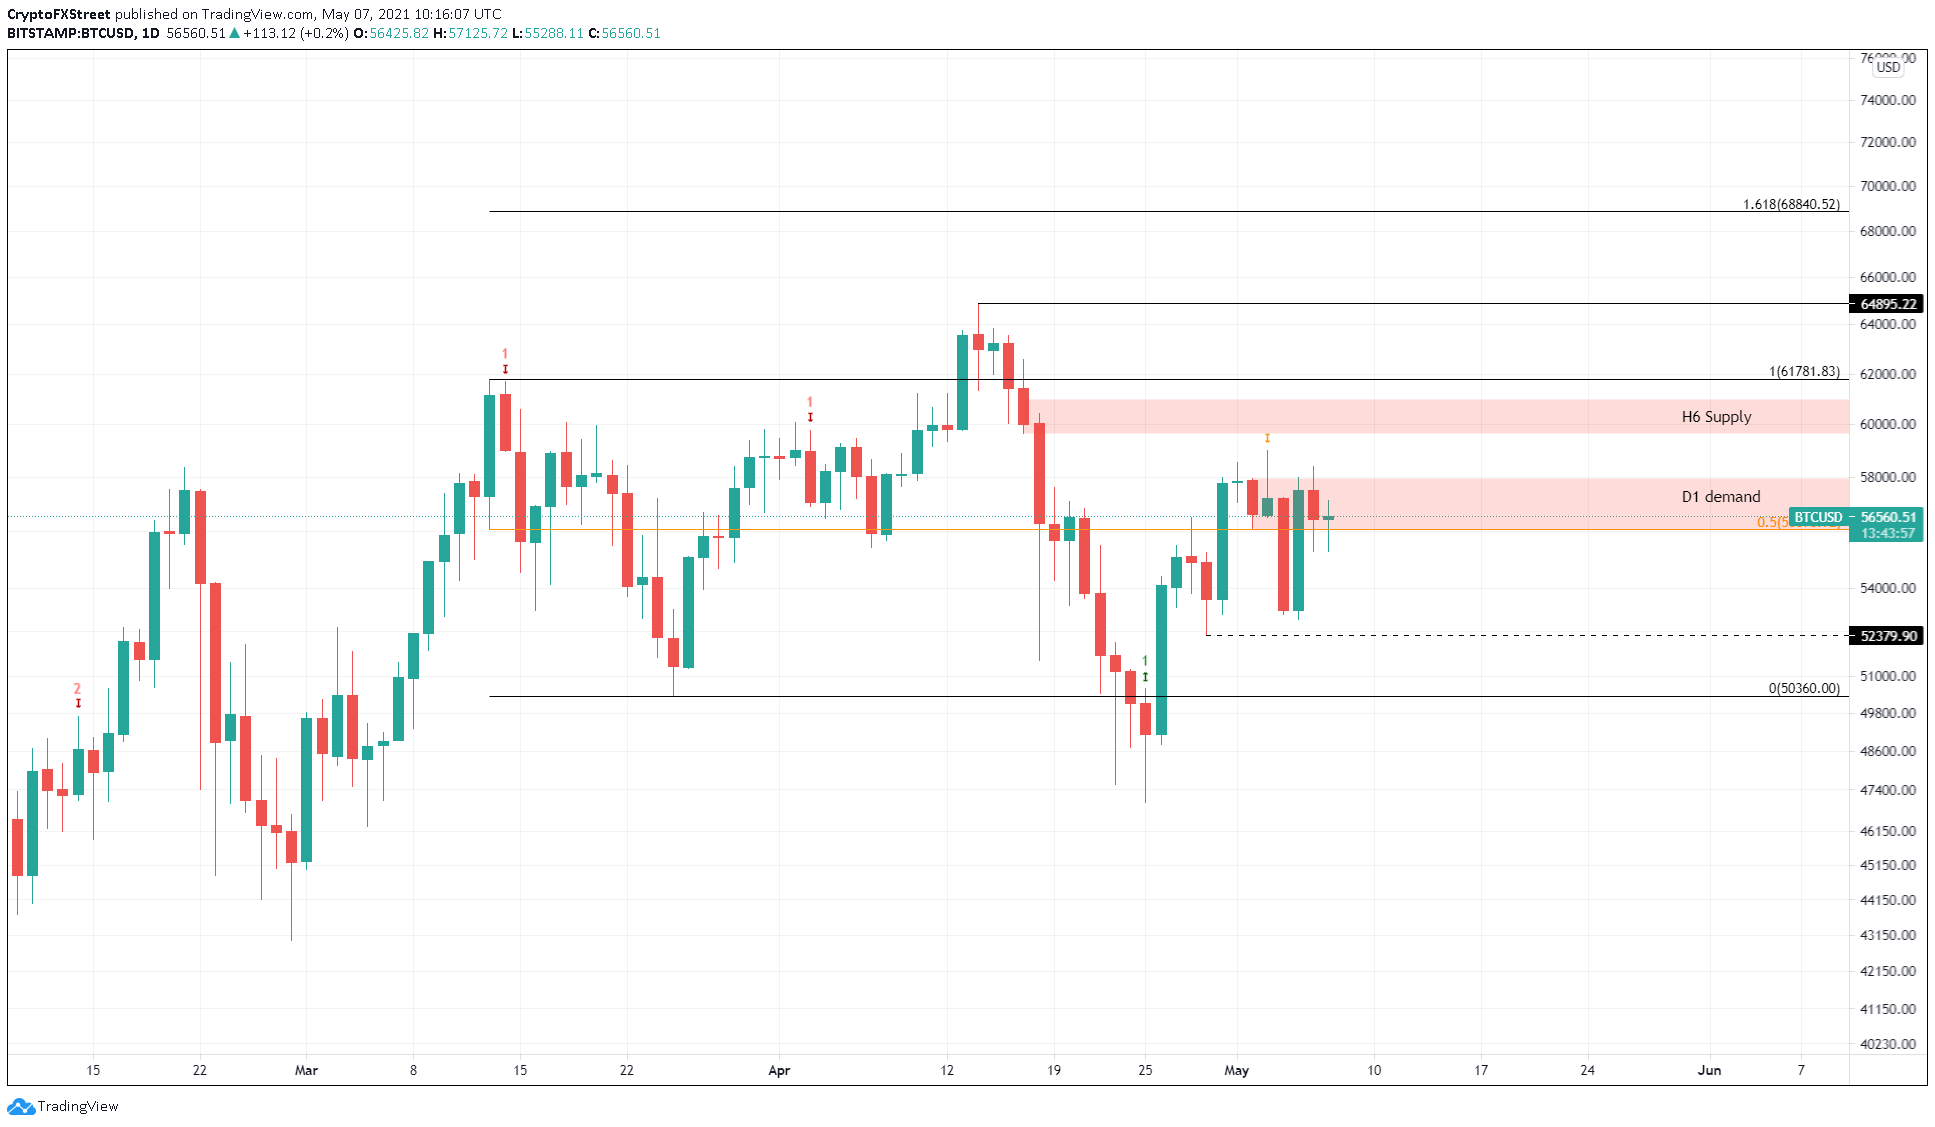
BTC/USD 1-day chart
Supporting the bullish narrative is the supply of BTC held on exchanges. Despite hitting an all-time high on April 14, roughly 1% of all the tokens held on centralized entities have been depleted, suggesting that investors are confident in the performance of Bitcoin price in the future.
Such market behavior depicts the strength of holders and reduces the effective sell-side pressure present primarily on these platforms.
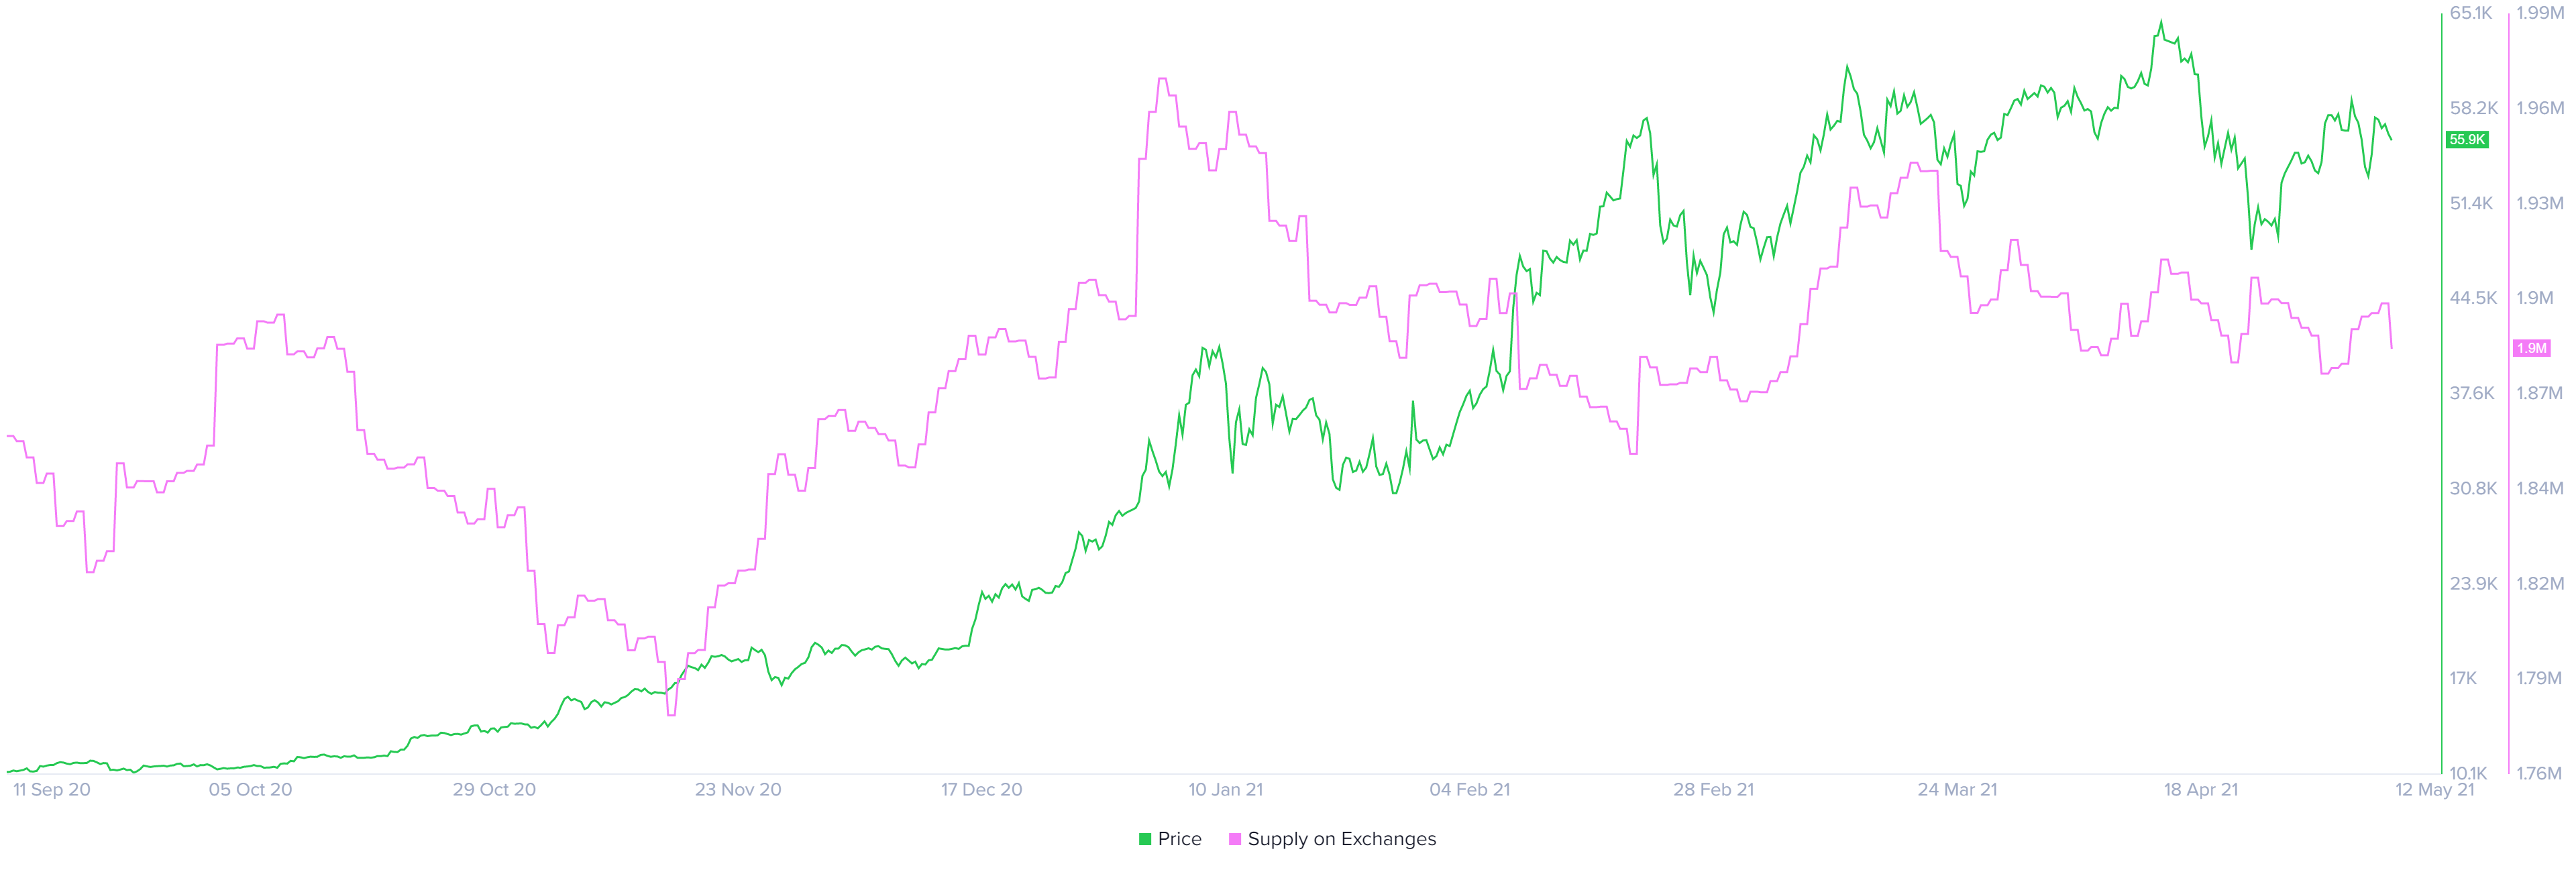
BTC supply on exchanges chart
While reduced selling pressure is a good sign, an increase in stablecoin supply on exchanges can be considered a proxy for buying pressure.
The stablecoin reserve on all exchanges has hit a new high of $11 billion, at the time of writing. Even using a portion of this vast count to buy BTC will positively affect its price.
This is a bullish sign because it indicates that any short-term dip in Bitcoin price may not overextend.
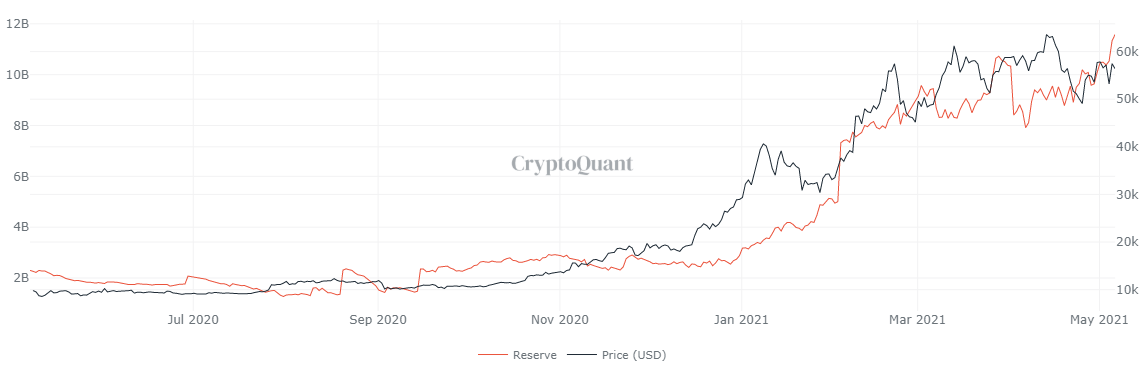
BTC stablecoin reserve chart
Glassnode’s Stablecoin Supply Ratio (SSR) is a combination of the two metrics previously mentioned. It is obtained by dividing BTC held on exchanges by its stablecoin reserve. A lower ratio indicates heavier buying power while a higher ratio indicates excess selling pressure
The SSR is currently at 12.98, a level last seen in early November 2020 before the start of the bull run. This perfect concoction of events might be able to kick-start another explosive run-up.
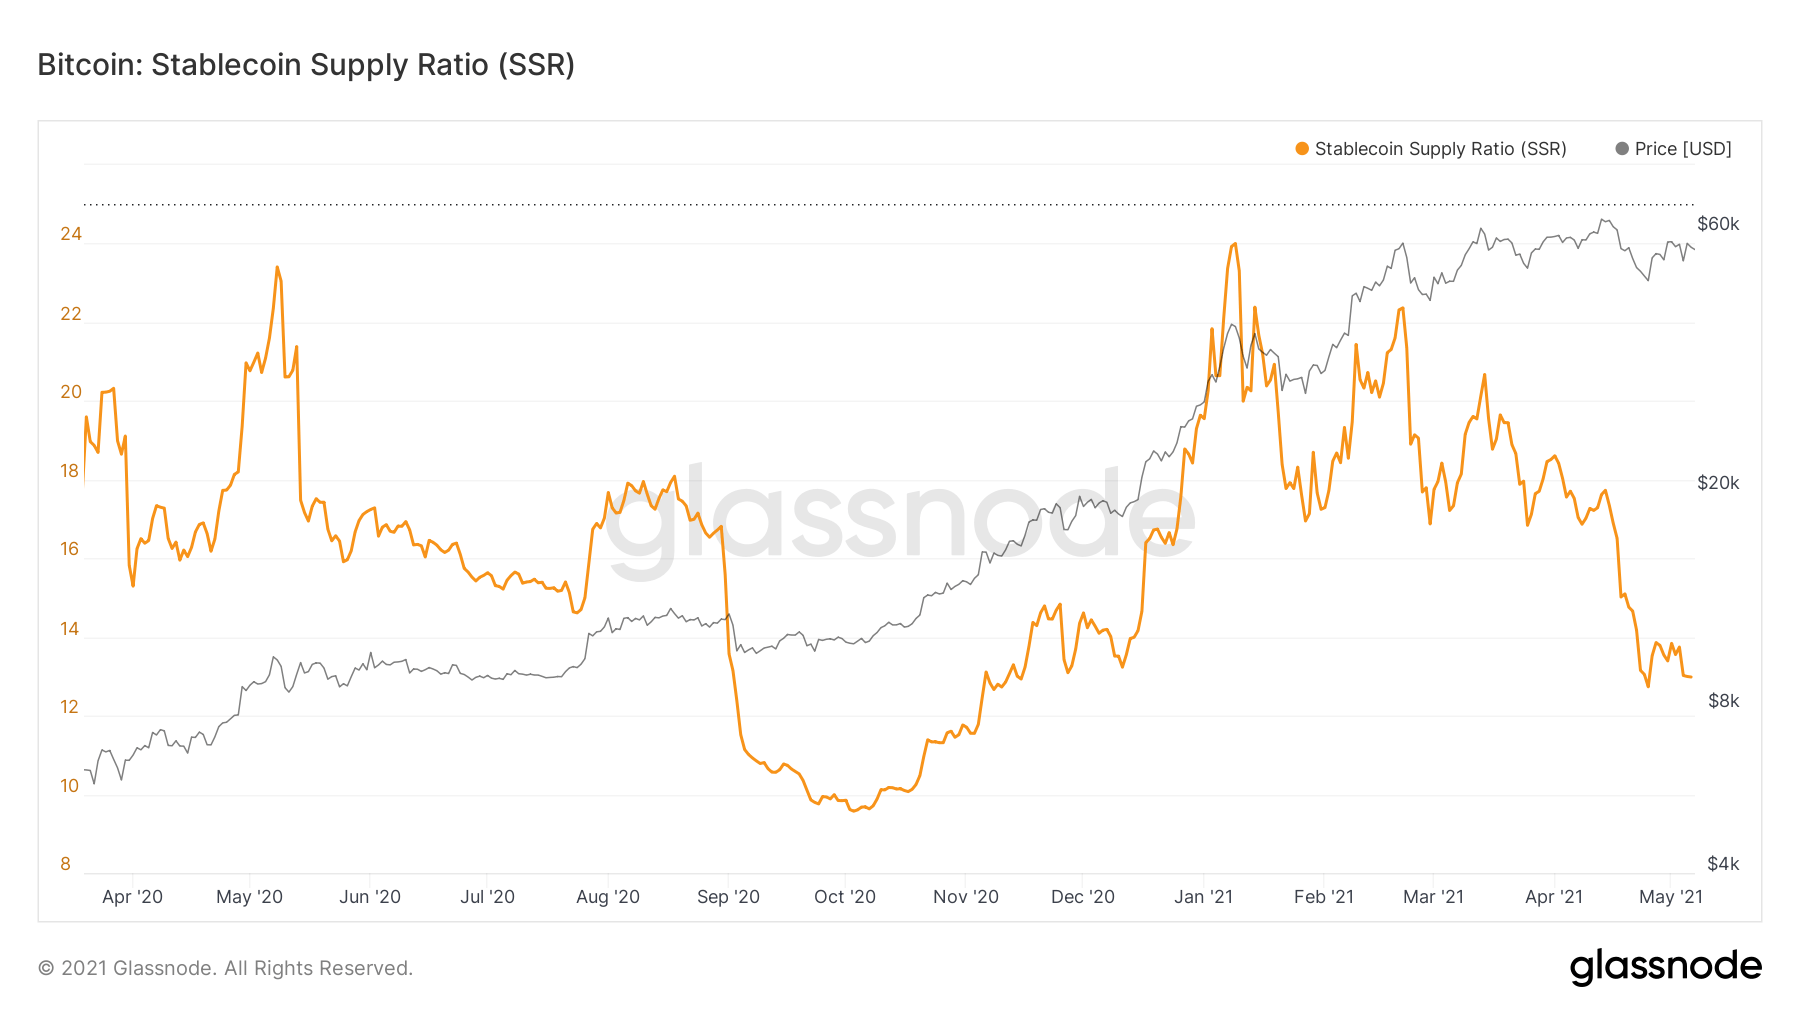
BTC stablecoin supply ratio chart
While the upswing outlook seems logical, a potential spike in selling pressure that leads to a decisive close below the 100-day SMA at $52,379 could be catastrophic . Under these circumstances, Bitcoin price might slide 4% to find temporary support.
If the bearish momentum continues to press, BTC may revisit the lows created on April 25 at $47,000.


