
- Bitcoin price weakens the $36,398 to $38,895 demand zone as it retests the barrier for the third time.
- On-chain metrics reveal that BTC has more room to move south before it finds a stable bottom.
- A daily close above $52,000 will invalidate the bearish thesis and kick-start a bull run.
Bitcoin price remains stuck between two crucial levels with no sign of directional bias. The immediate support area that prevented a steep correction seems to be getting weaker with every retest, indicating that a breakthrough to the downside is likely.
Bitcoin price and the chances of capitulation
Bitcoin price is consolidating between roughly $45,000 and $35,000 and has been doing so for the last two months. The crash in late January met with an equally strong buying pressure, leading to a close above the $34,752 support level.
This level has been crucial in preventing a steep correction to the downside. As BTC recovered from this crash, it set up a demand zone, ranging from $36,398 to $38,895. For the better half of this coiling-up phase, BTC respected this barrier and saw impressive impulse moves from this area.
However, as Bitcoin price tags this barrier for the third time, the allure and strength of the said barrier seem to be on a decline. Therefore, the current retest could shatter this barrier and make way toward the $34,752 support level.
A daily close below this foothold will be key in triggering a crash to the $30,000 psychological barrier. If such a scenario were to occur, BTC would likely extend lower and collect sell-stop liquidity resting below the $29,100 support level, which served as a launchpad in July 2021.
From a conservative standpoint, the crash to $29,100 could serve as a capitulation move, marking a potential bottom. In a dire case, a breakdown of the aforementioned level will push BTC to $23,000, which could be the second potential bottom.
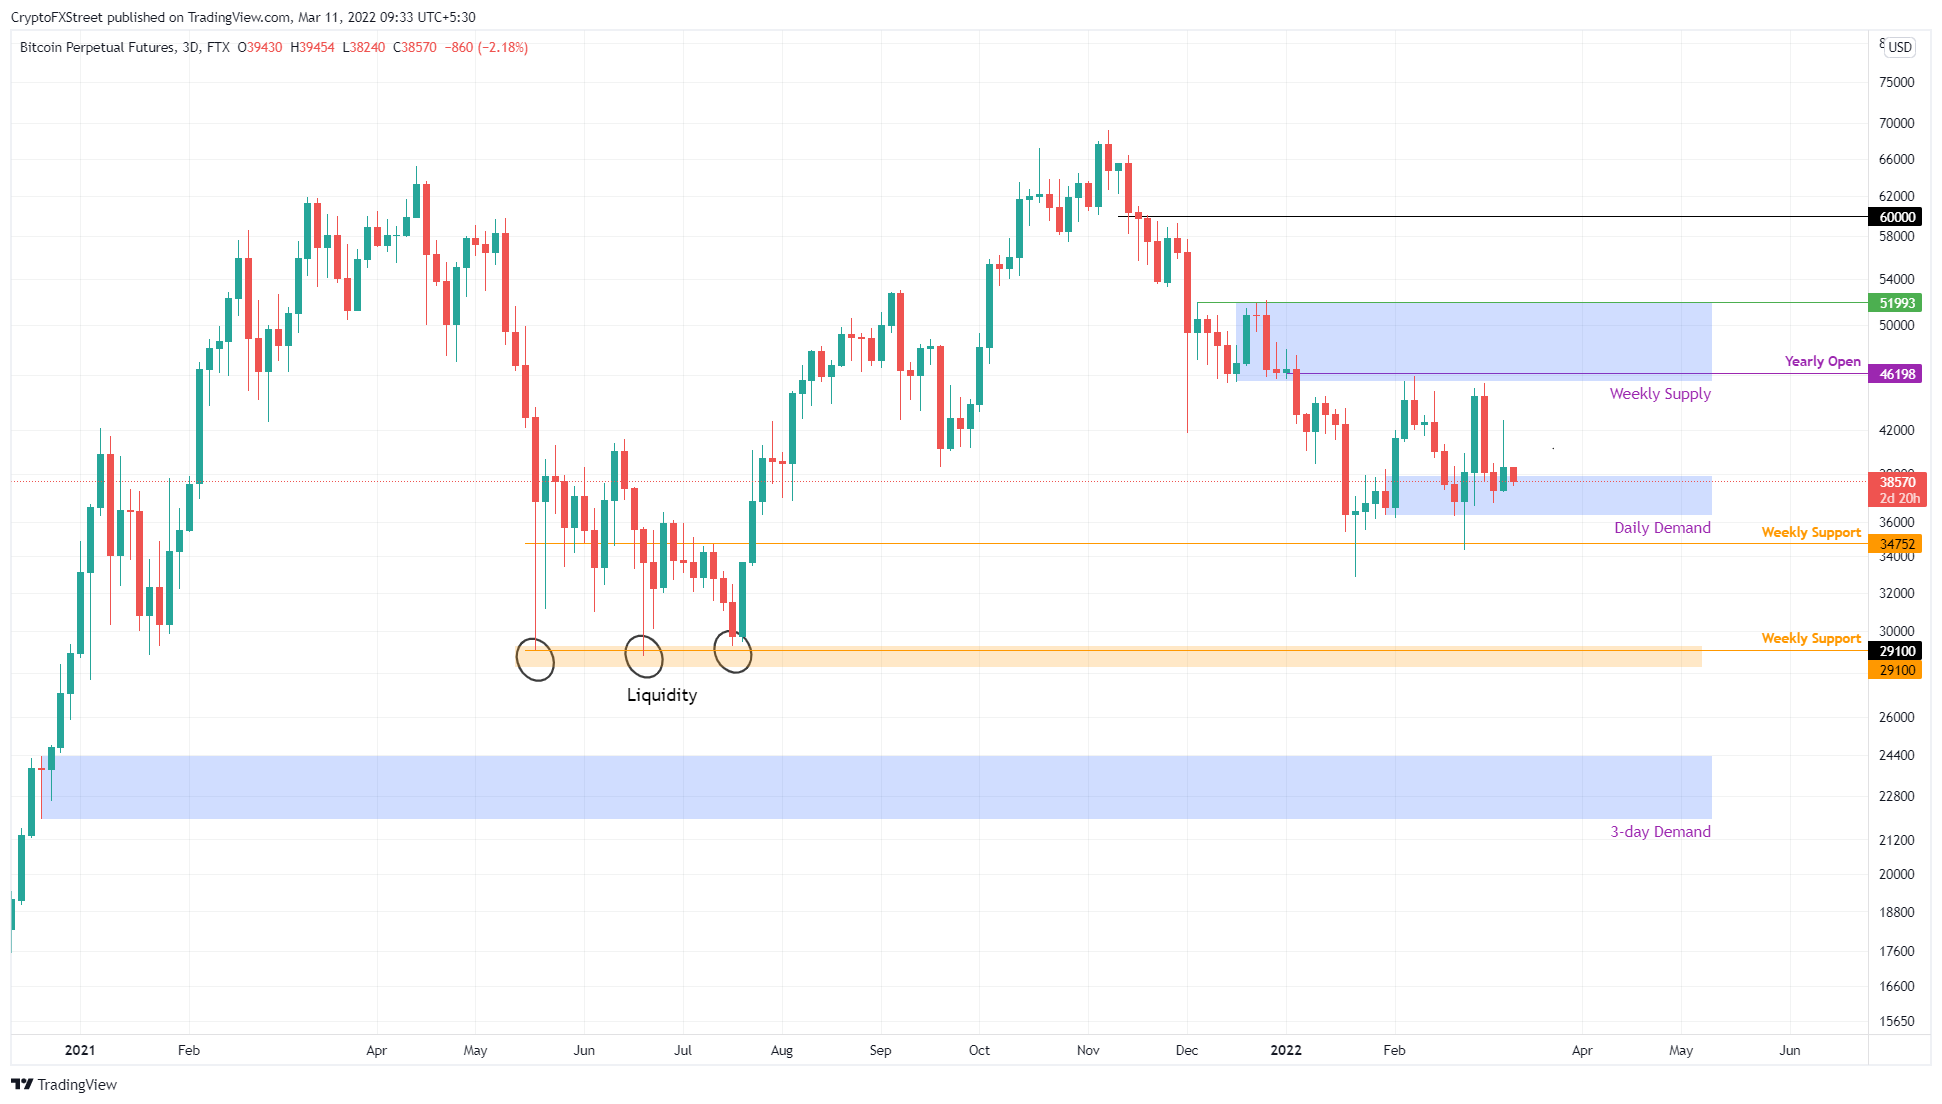
BTC/USDT 1-day chart
Supporting the technical viewpoint for Bitcoin price is IntoTheBlock’s Global In/Out of the Money (GIOM) model. This index shows that roughly 5.06 million addresses purchased nearly 2.45 million BTC at an average price of $23,251.
Therefore, this area will be a significant level of support and extends from $11,443 to $36,754. Hence, a breakdown of the $36,754 support level could be the key to a catastrophic crash to $30,000 or $23,251.
Interestingly, these levels align perfectly with the barriers mentioned from a technical perspective.
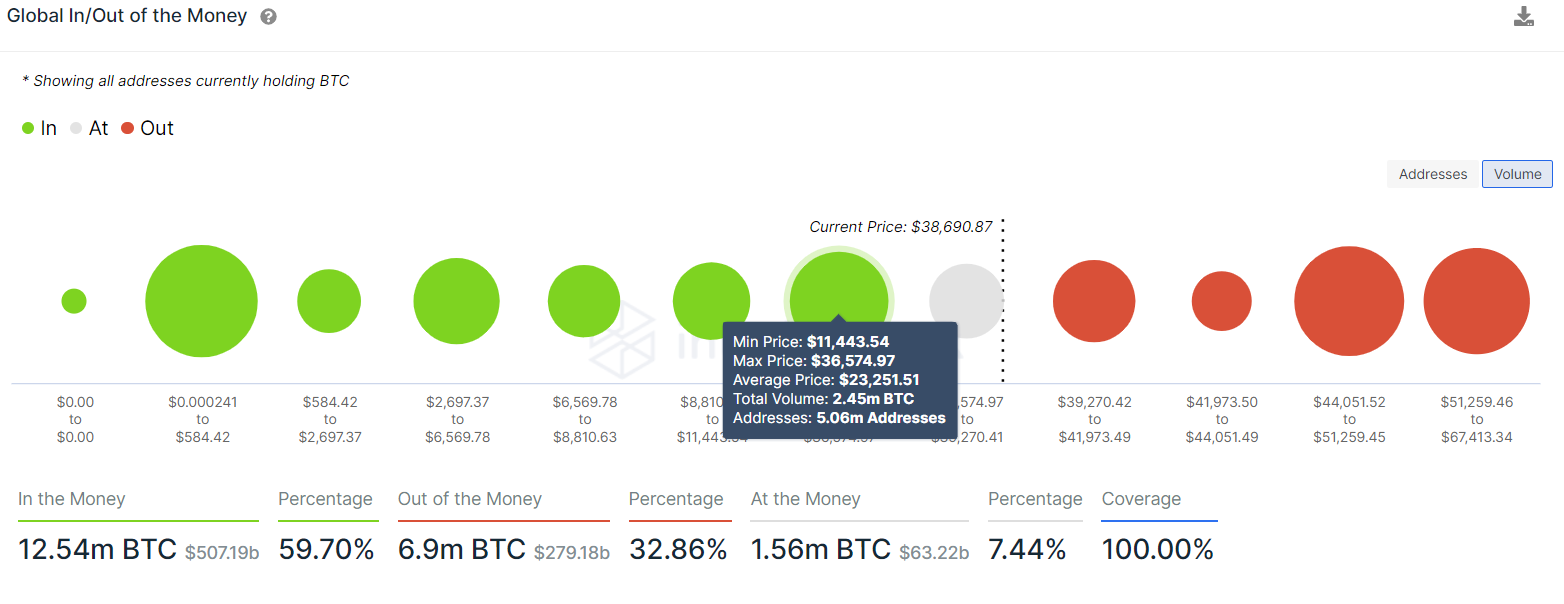
BTC GIOM
Painting a clear picture of the potential crash is the supply in loss indicator. As the name indicates, this indicator is used to determine the BTCs that are underwater since the purchase. Roughly 5.8 million BTCs are at a loss, which is a relatively higher number compared to the lowest point of the July 2021 crash.
This structure indicates that more investors are underwater, and an unexpected flash crash could liquidate these holders and snowball the crash to visit levels last seen in December 2020. Assuming this development would come to pass, it would be the perfect setup for a capitulation crash.
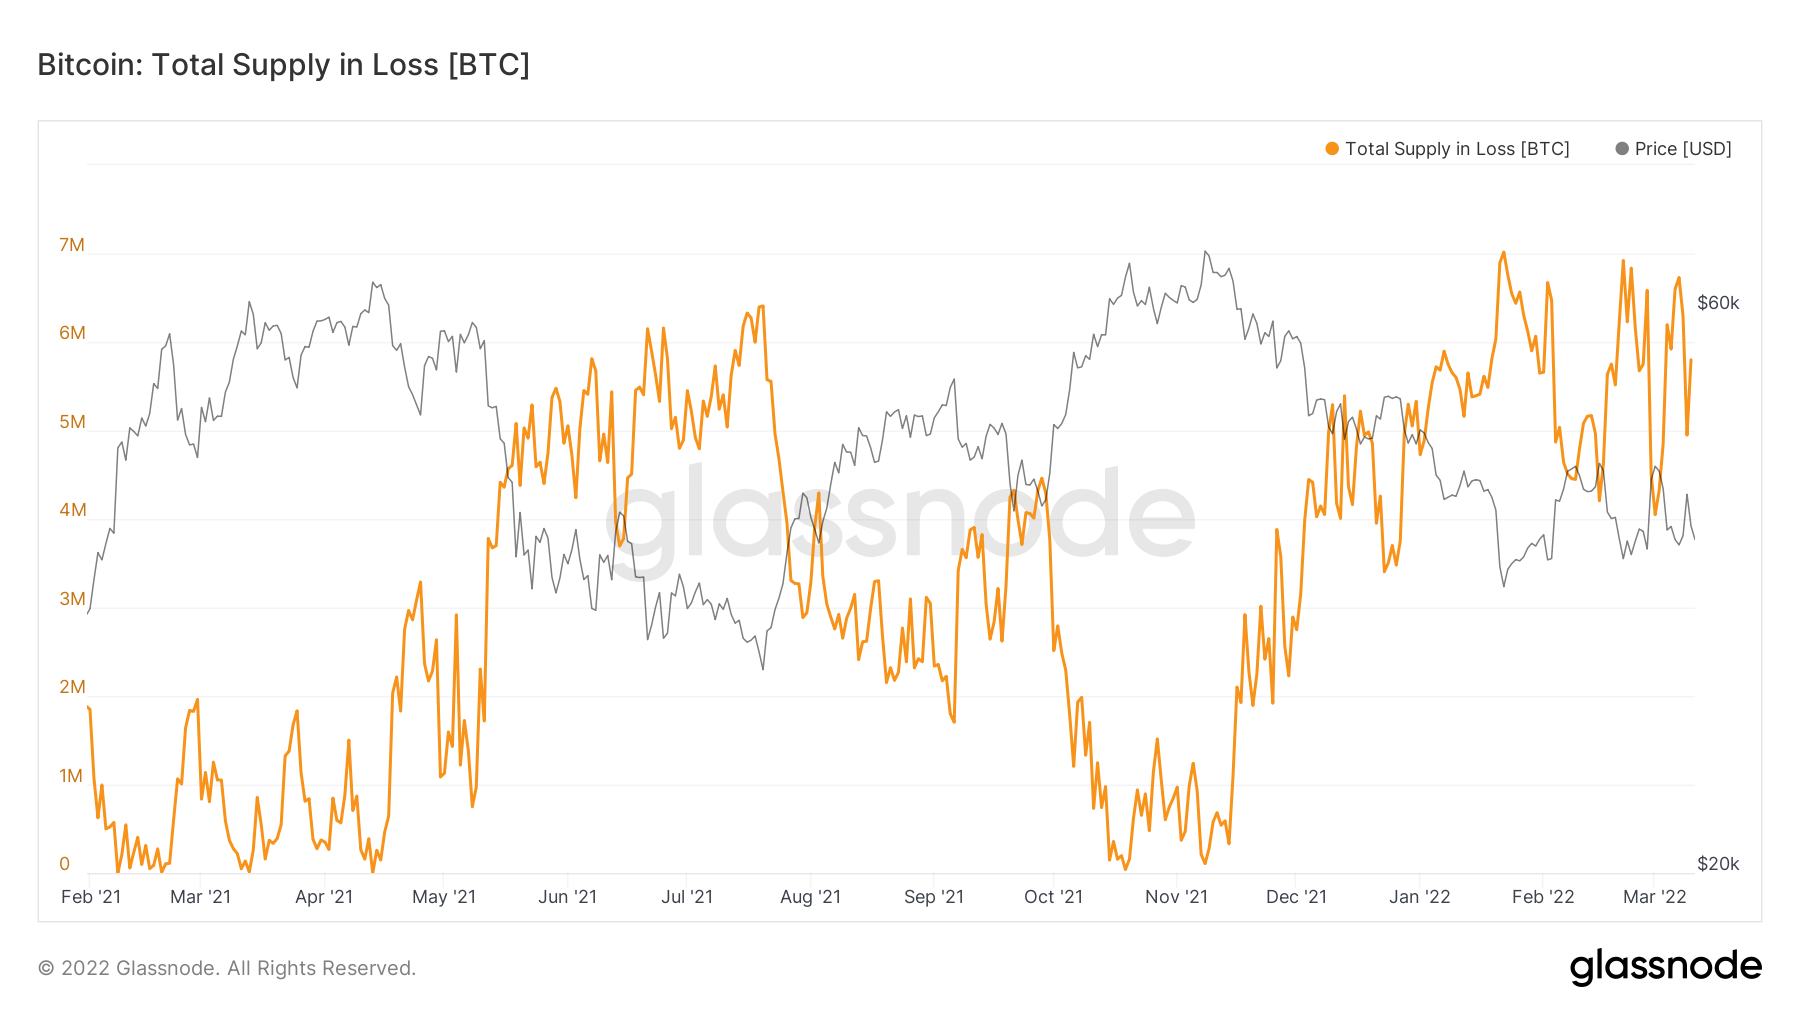
BTC supply in loss
Further adding credence to a steep correction is the Market Value to Realized Value Z-score (MVRV Z-score). This on-chain metric is used to assess if an asset is overvalued or undervalued and does so by dividing the difference between the market capitalization and realized market capitalization with the standard deviation of the market capitalization.
It takes the MVRV metric to a new level by determining historical areas of fair value, oversold or overbought. The red band indicates overbought and is typically where the bull run stops and reverses. However, the green value indicates oversold and is where long-term holders tend to accumulate.
For BTC, the Z-score is at 1.16, indicating room for it to crawl toward the green band. This move would require Bitcoin price to dip much lower than its current position, indicating that the crash is plausible and required for a bottom to set in.
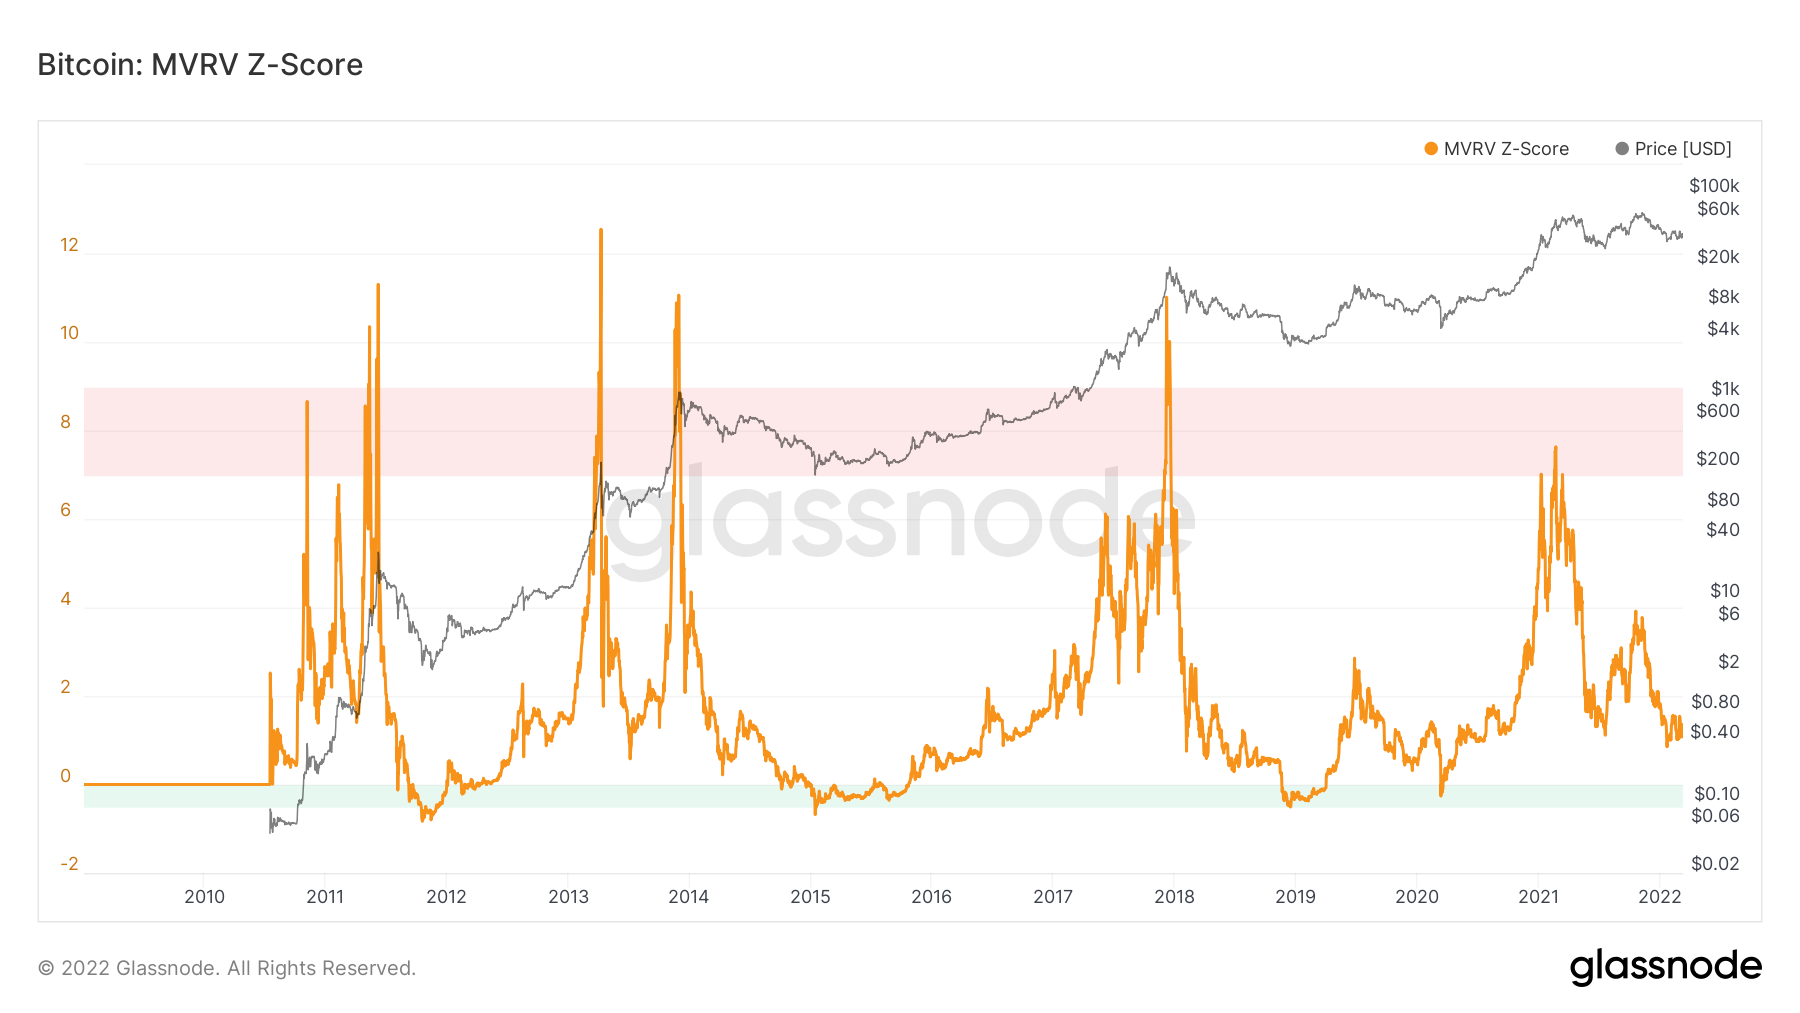
BTC MVRV Z-score
On a similar note, on-chain analyst Willy Woo stated that institutions and large holders are selling, flipping the narrative to bearish. He added,
There’s no question we are in a bear market due to the duration of the sell-off. There’s never been a bottom of a bear market in BTC without a capitulation event, so I think there is a high probability that this region breaks down, and we test lower lows before accumulation takes place to setup for the next bull cycle.
While all the signs point to a bleak future for Bitcoin price, the supply on exchanges seems to be painting a hopeful picture, at least from an ultra-macro perspective. The number of BTC held on centralized entities serves as a potential sell-side pressure; hence, a decline would represent a bullish outlook.
The supply of BTC on such platforms has dropped from 2.69 million to 2.03 million from May 19, 2021, further adding a sense of relief for long-term holders.
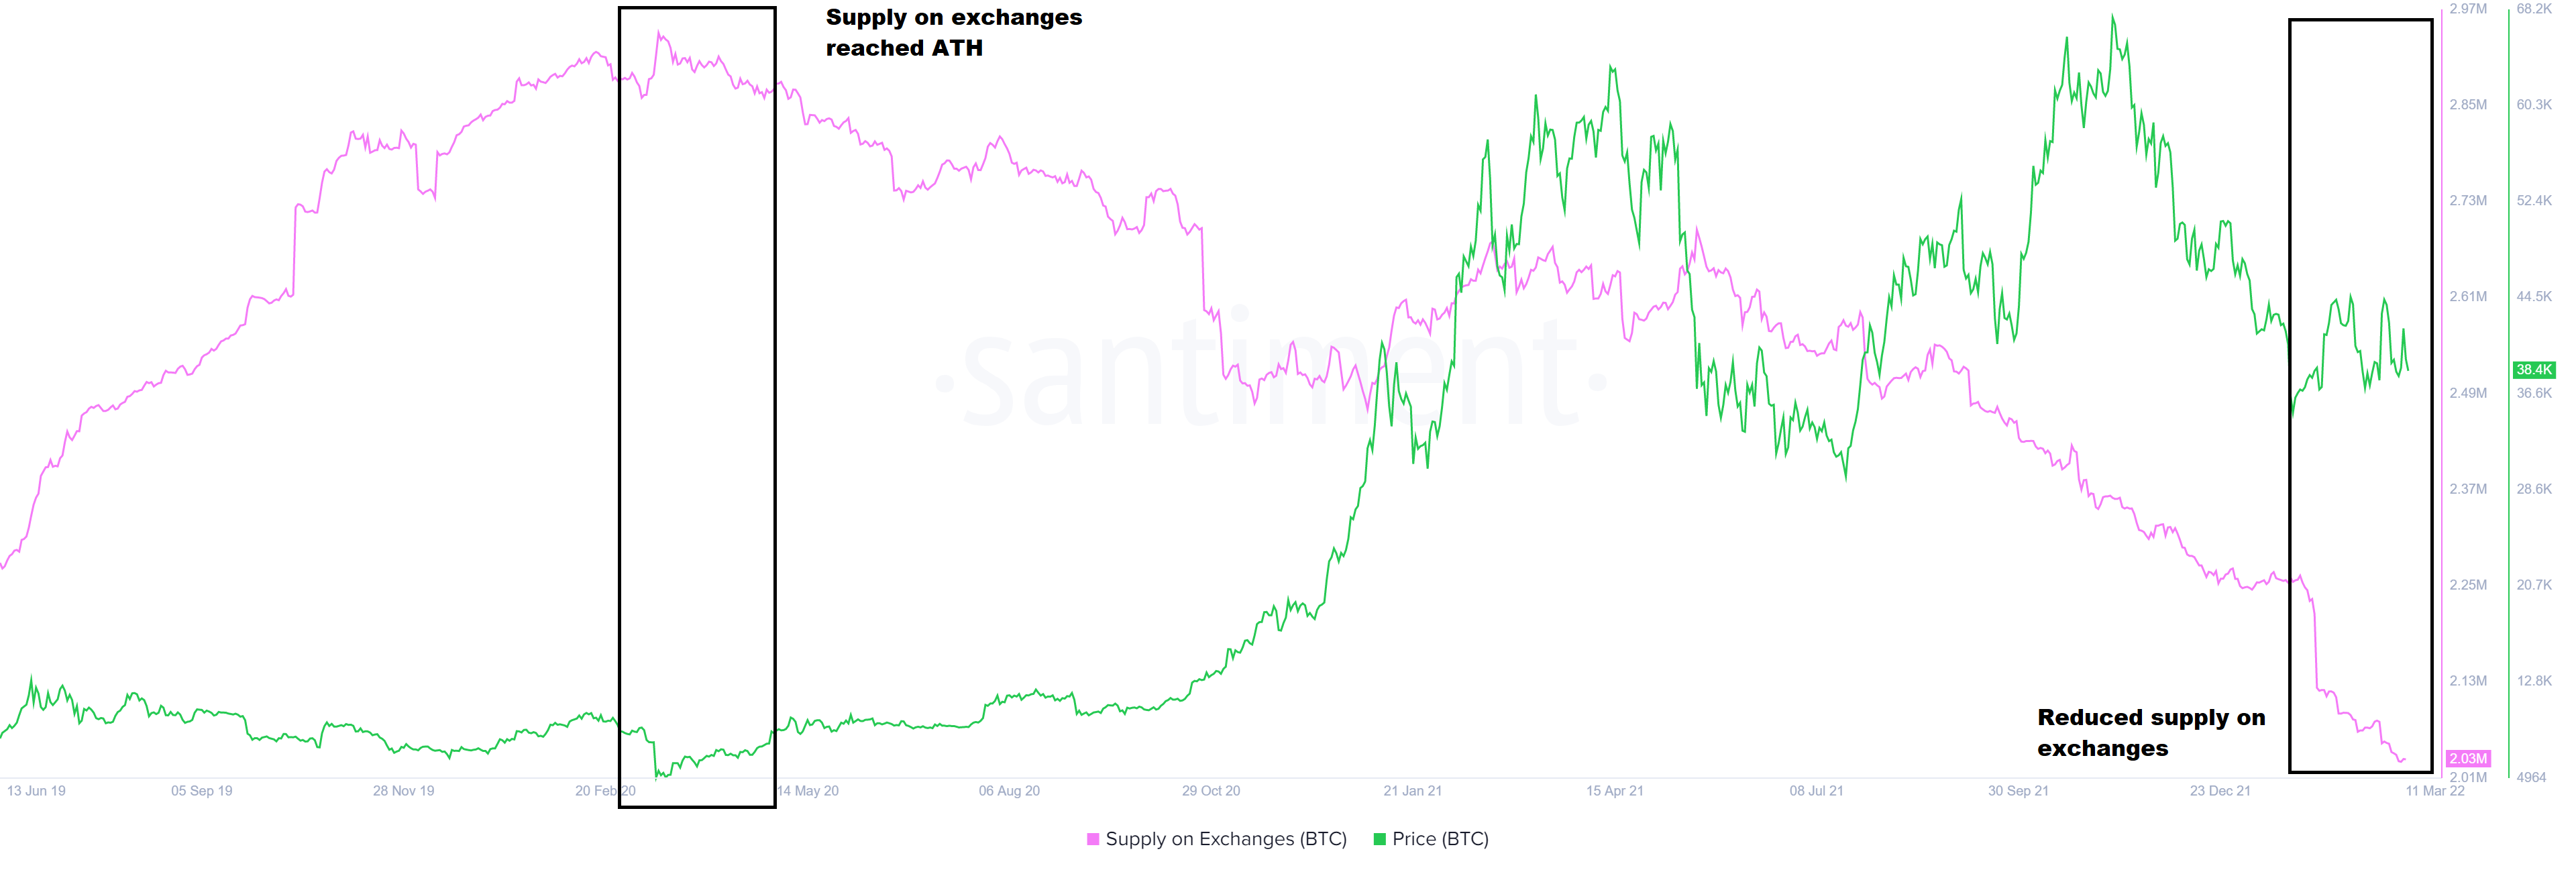
BTC supply on exchanges
The bearish thesis for BTC will face invalidation with a daily or a weekly close above the $52,000 hurdle. This move would set up a higher high and open the path for Bitcoin price to explore higher and revisit the $60,000 psychological level.
With a sufficient increase in buying pressure, the big crypto might even set up a new high at $80,000.


