
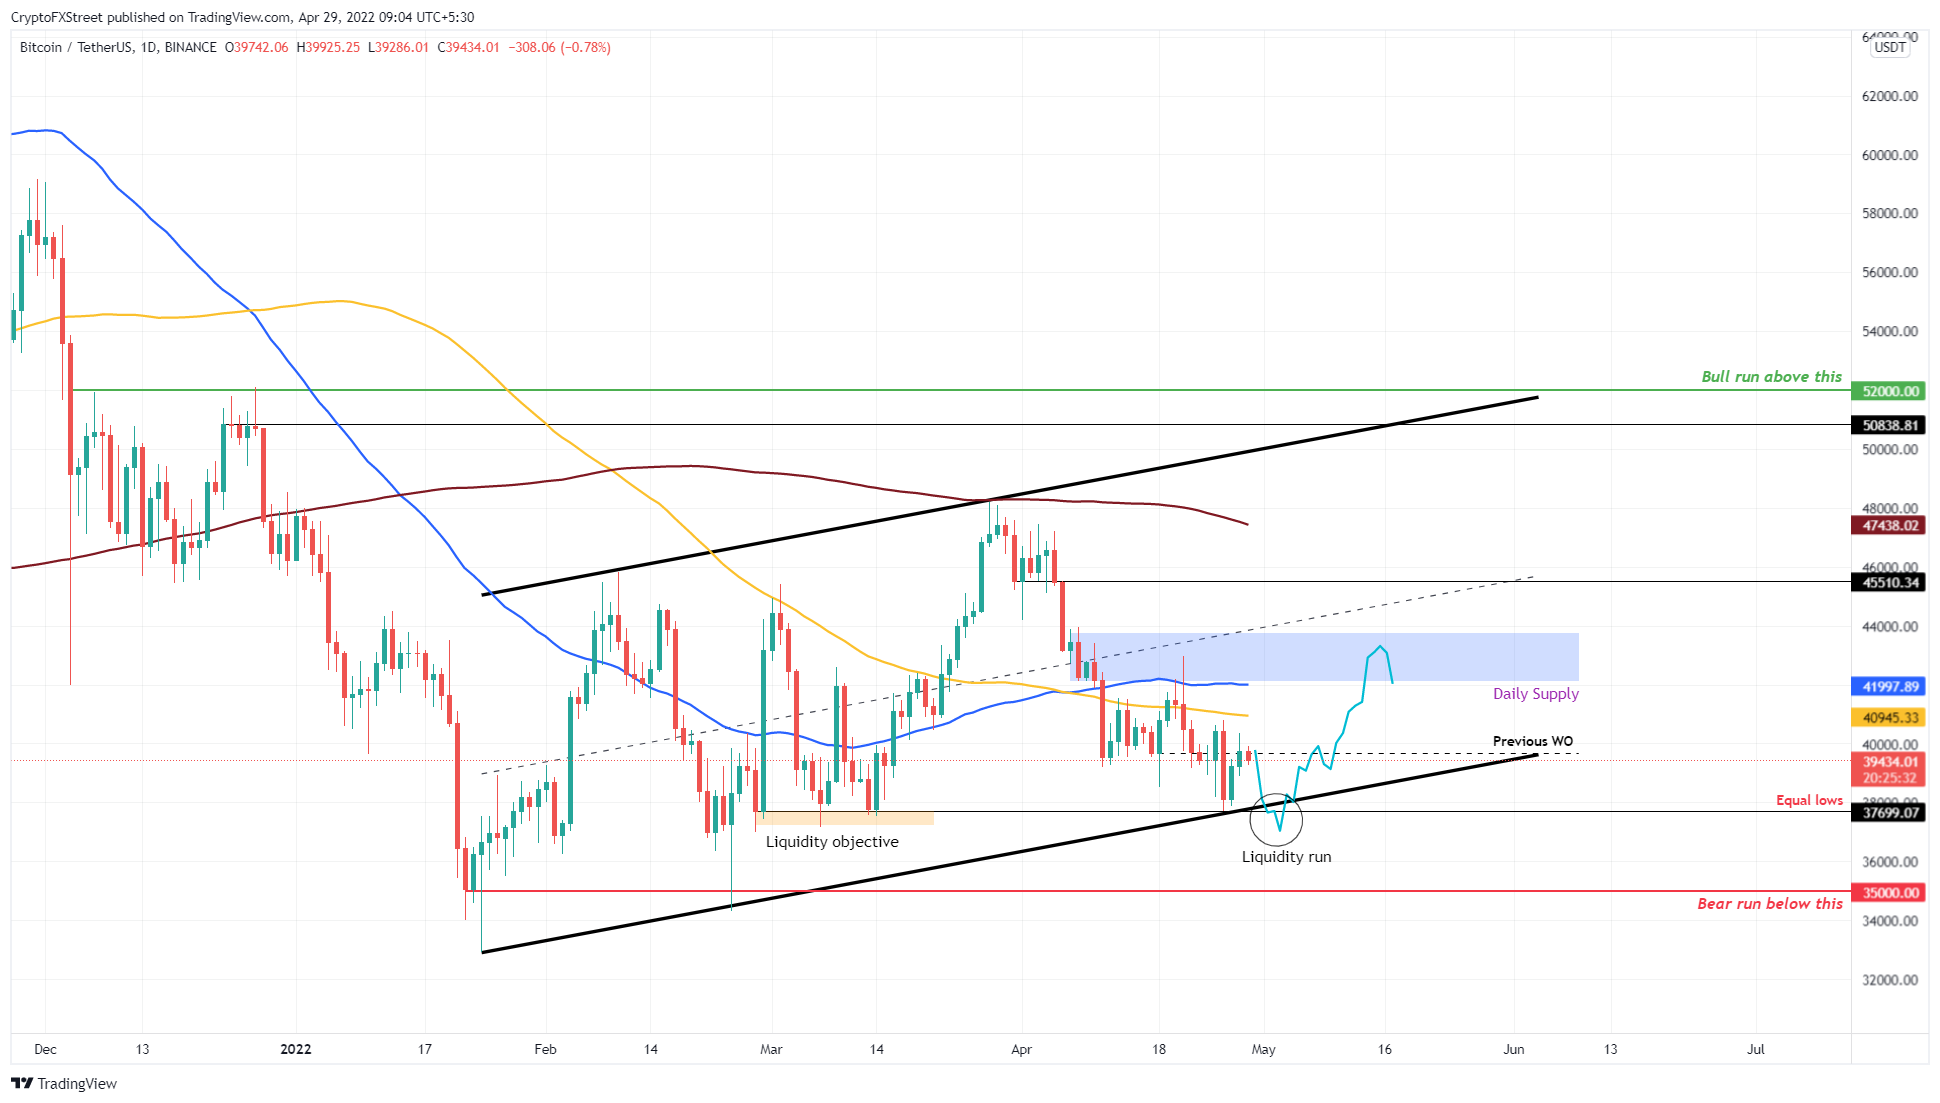
- Bitcoin price is likely to slide below $37,699 to collect liquidity before heading higher.
- Investors can expect an 11% upswing to $42,000 for the big crypto after a liquidity run.
- A daily candlestick close below $35,000 will invalidate the bullish thesis.
Bitcoin price has prematurely triggered a minor run-up, leaving its downside objective unfulfilled. Therefore, investors can expect BTC to slide lower and collect liquidity below a significant level before triggering a full-blown impulse move.
Bitcoin price needs to complete its downside objective
Bitcoin price is traversing an ascending parallel channel, obtained by connecting the three higher lows and two higher highs formed since January 24. The last two retests of the lower trend line of the pattern have led to a bounce to the upper limit.
The third retest is unlike the ones that came before it due to its slow downtrend. Moreover, the downtrend that pushed Bitcoin price from $48,189 to $37,702, failed to push it below the equal lows formed around $37,699.
Therefore, investors should expect a move to the downside that collects liquidity before it heads higher. A sweep below $37,699 will be the trigger that pushes BTC up by 11% to retest the $42,125 to $43,766 supply zone. Interestingly, this level also coincides with the 200-day SMA, making it a tough barrier and a place where the local top could form.
Only a daily candlestick close above $43,766 will allow the Bitcoin price to navigate to $45,510. This move would constitute a 20% ascent.
BTC/USDT 1-day chart
Supporting this short-term downswing in Bitcoin price is the 30-day Market Value to Realized Value (MVRV) indicator. This indicator is used to measure the average profit/loss of investors that purchased BTC over the past month.
Any value of -10% to -15% is termed as an “opportunity zone” since short-term holders are at a loss and are less likely to sell, while long-term holders accumulate. Hence, a local bottom is often formed around these levels.
For BTC, however, the index is hovering around -7.1%, which is just above the first local bottom at -11% This downswing is often where the local bottom is formed, but there are a few times when BTC has dropped to -18.7%. So, there is a good chance for Bitcoin price to drop to these levels again, which aligns well with the outlook described from a technical perspective.
 [09.07.33, 29 Apr, 2022]-637868033071712235.png)
BTC 30-day MVRV
While this minor downswing might seem bearish, the whales holding between 1,000 to 10,000 BTC have increased from 2044 to 2,193 since February 24. This sudden uptick in the number of wallets holding massive amounts of BTC serves as a proxy for these whales’ investments, who are expecting an uptick in Bitcoin price.
Therefore, the long-term outlook for BTC remains mildly bullish, which aligns with the technical outlook’s target of $45,510.
 [09.25.59, 29 Apr, 2022]-637868033213520118.png)
BTC supply distribution
Regardless of the short-term downswing expectation, the big crypto is positioned for a trend reversal. However, if the bears take control and push BTC lower, leading to a daily candlestick close below the $34,752 significant level, it will create a lower low and invalidate the bullish thesis.
In this situation, BTC market makers might tug BTC to nosedive and collect the sell-stops present below the $30,000 level.


