
Bears are giving no chance for even a short-term bounce back. Respectively, all the top 10 coins remain in the red zone.
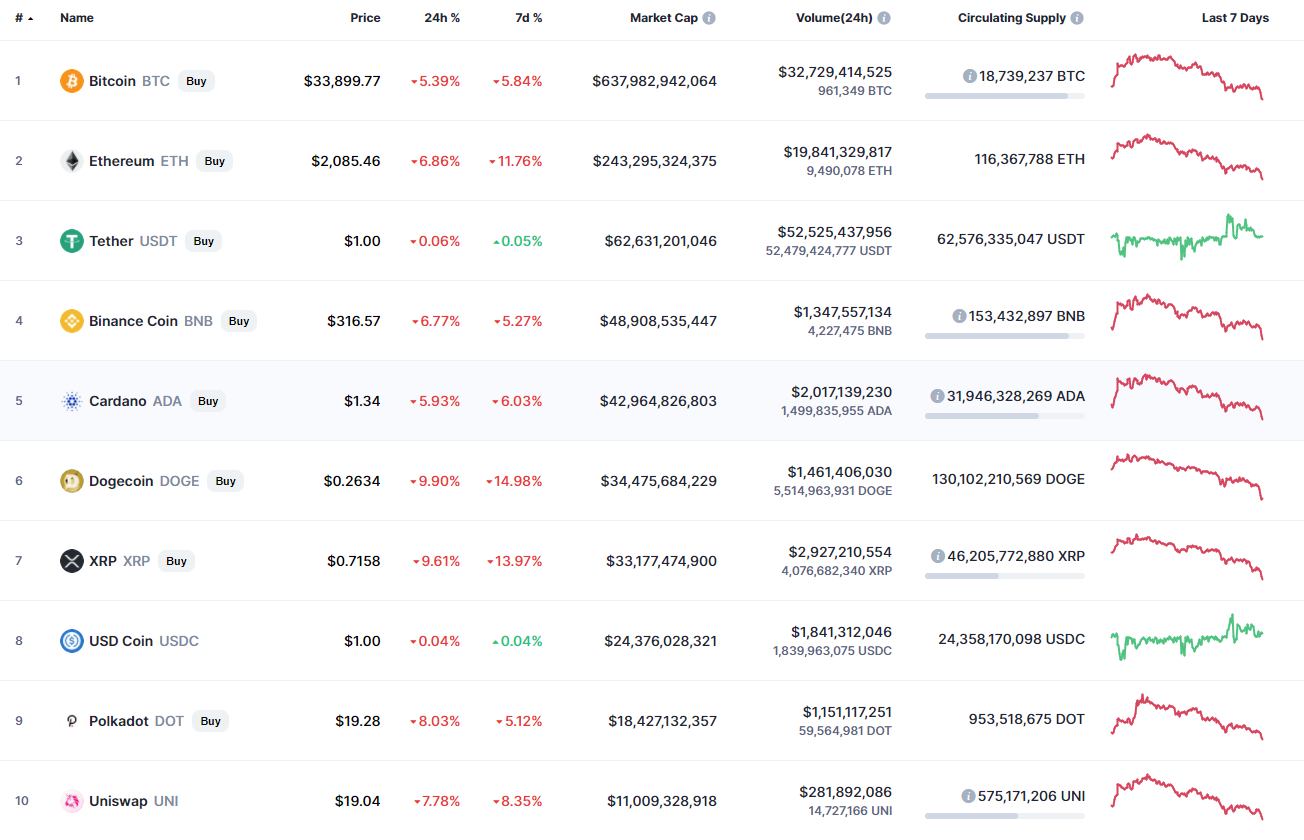
Top coins by CoinMarketCap
Due to the ongoing bearish influence, the dominance rate of Bitcoin (BTC) keeps rising and now is 45 percent.
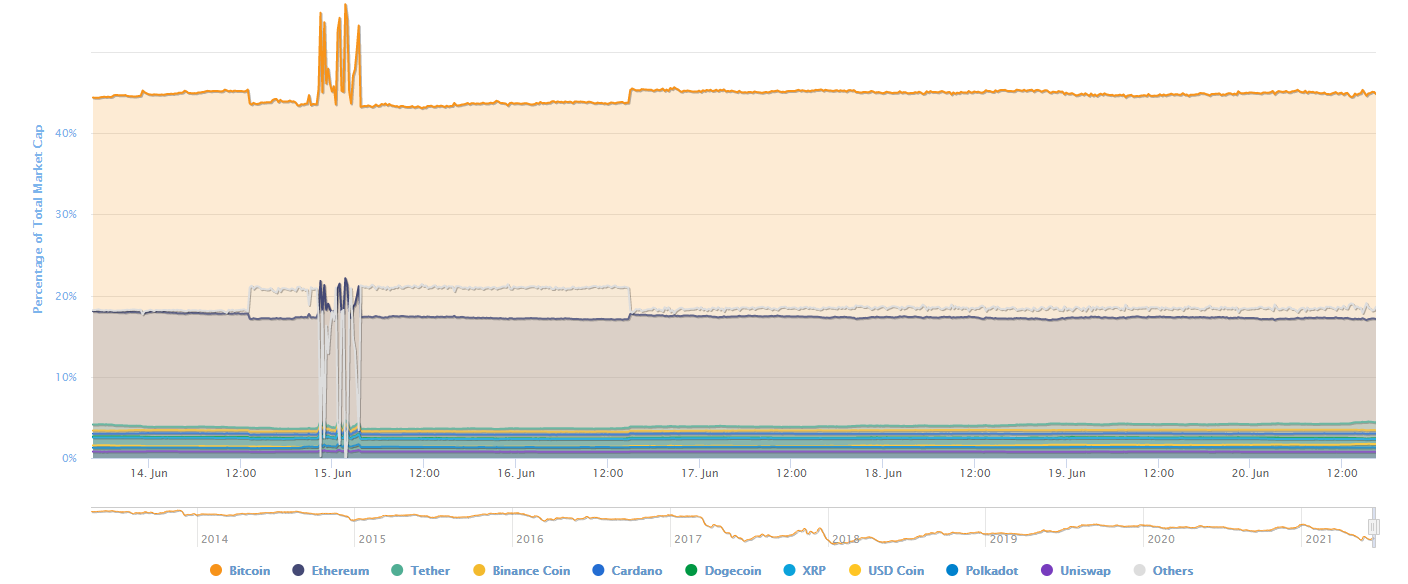
BTC market share
BTC/USD
Bitcoin (BTC) could not fix above $35,000, having confirmed the bearish scenario. Its price has gone down by almost 6 percent over the last day.
BTC/USD chart by TradingView
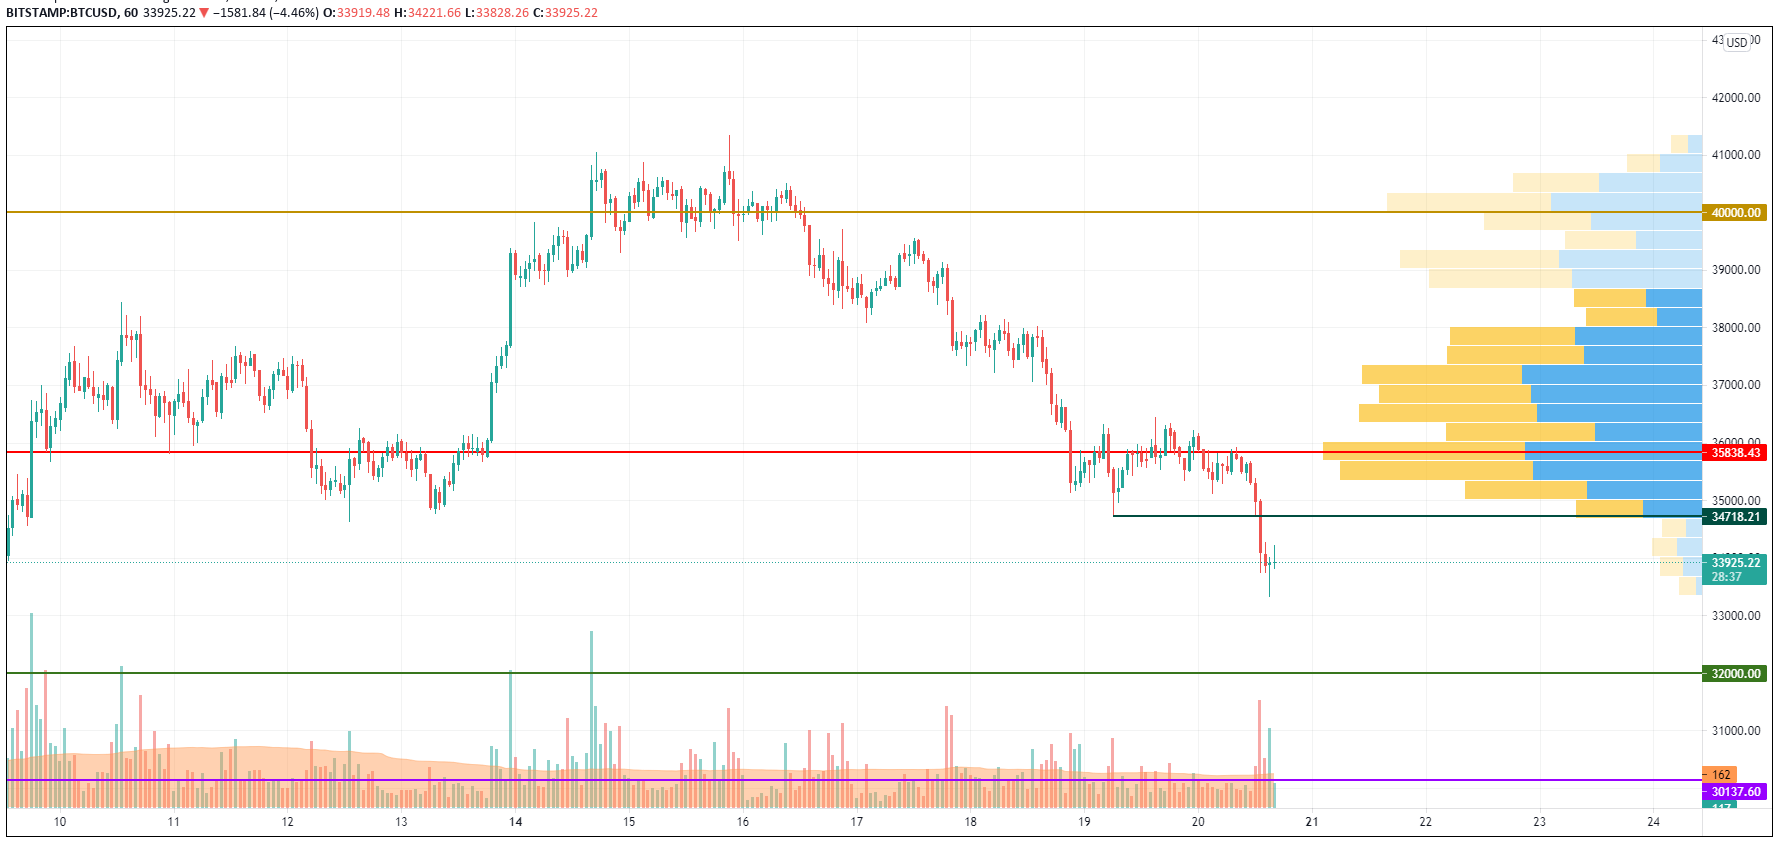
On the hourly chart, Bitcoin (BTC) might show a short-term bounce. The trading volume tends to increase, which means that there is a high chances of an uptick to the resistance around $35,000 where most of liquidity is focused. Also, there is an unfilled gap located in that zone.
BTC/USD chart by TradingView
On the higher time-frame charts, Bitcoin (BTC) is oversold. However, the bearish trend might not have finished. In this case, there is a high possibility to see a test of the formed mirror level at $34,700, followed by the ongoing decline.
BTC/USD chart by TradingView
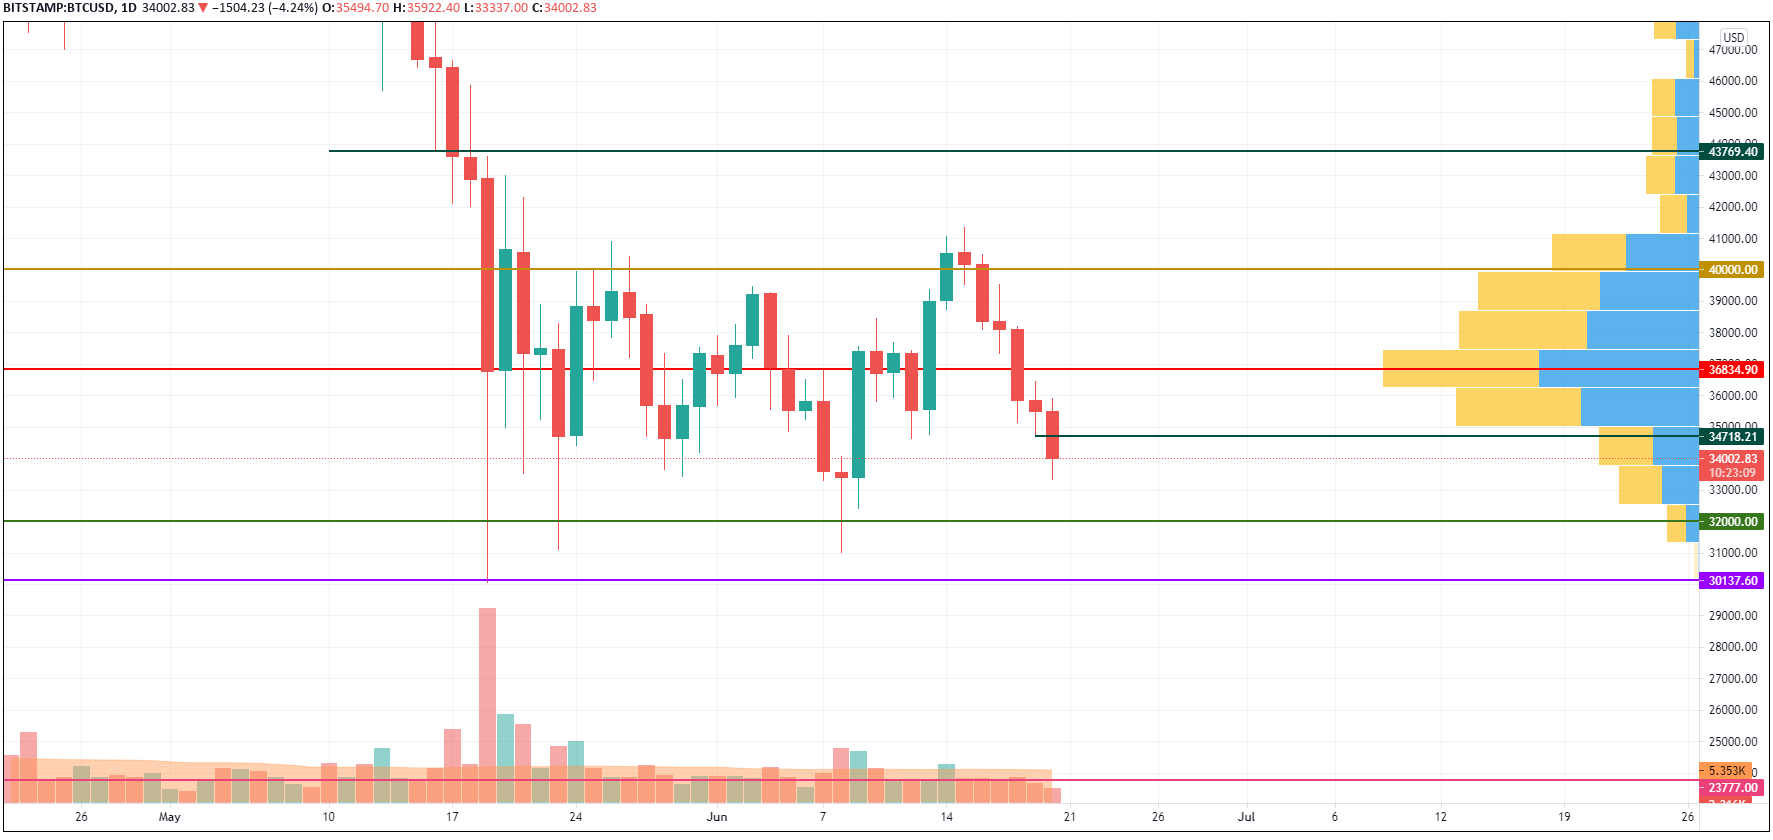
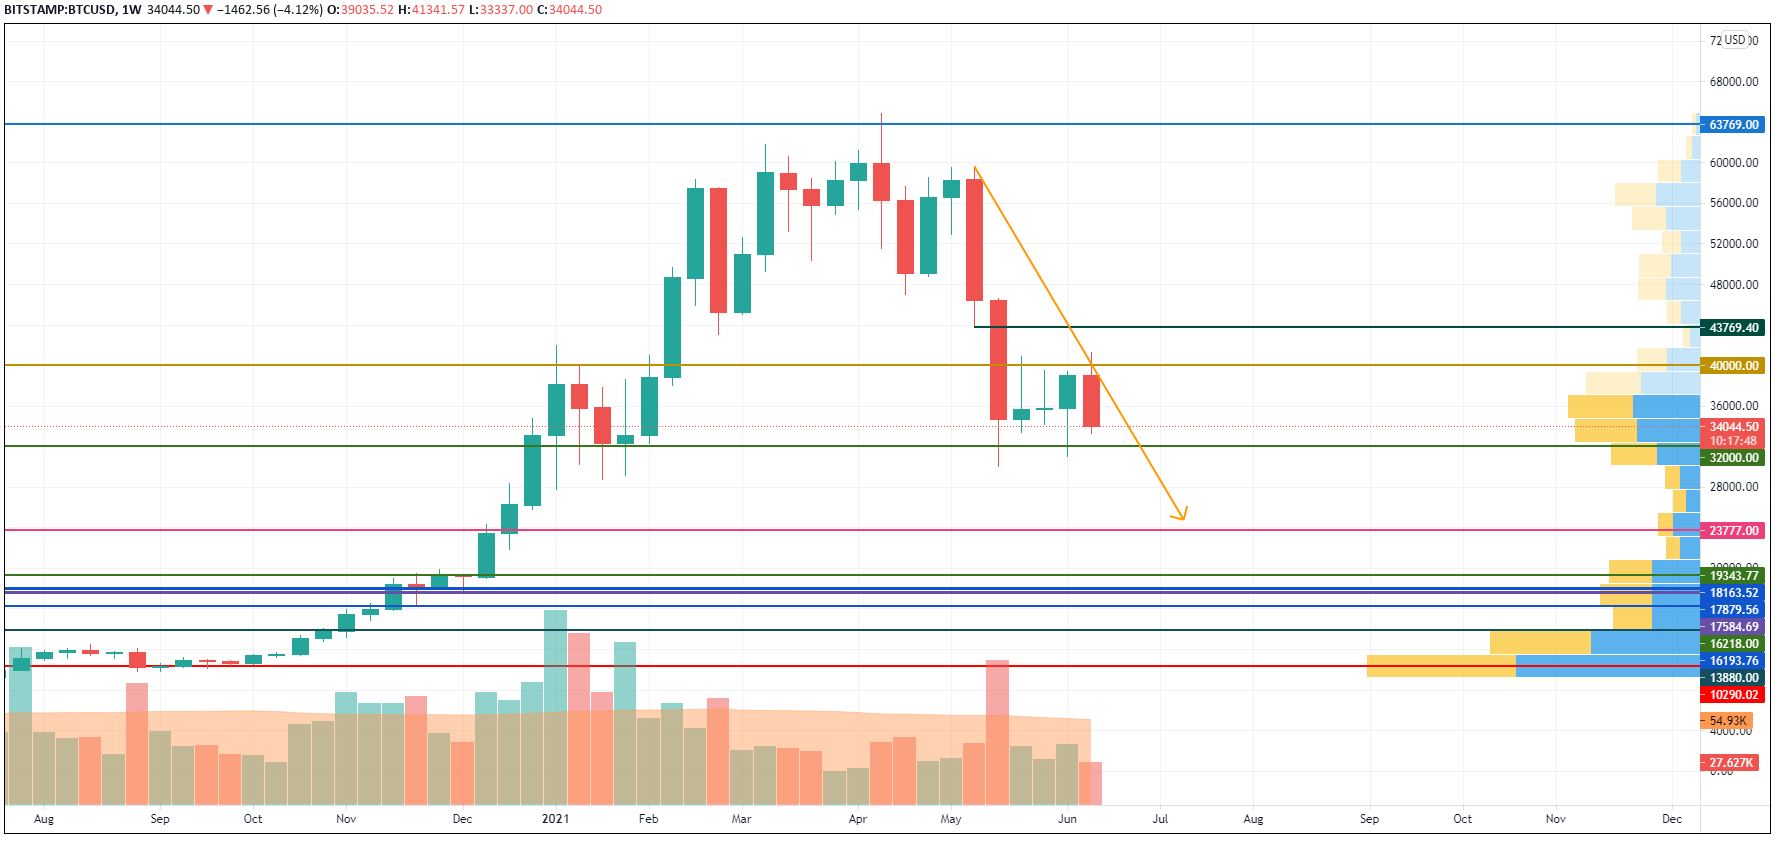
On the weekly time frame, the situation is bearish as buyers could not gain footing above the $40,000. At the moment, Bitcoin (BTC) is in the accumulation phase.
If sellers break the $32,000 mark and fix below it, the next level where bulls may seize the opportunity is $23,700.
Bitcoin is trading at $39,970 at press time.


