
- Cardano price action displays a highly probable bearish continuation.
- Another swift sell-off before buyers return is the most likely scenario.
- Upside potential exists but will be difficult to achieve.
Cardano price action continues to dip lower and lower, following the broader market in a continued downtrend. Time cycles indicate relief may not come until June.
Cardano price enters the longest downtrend since 2018
Cardano price has recently achieved a significant and historical marker. That marker is ADA officially hitting the longest downtrend since 2018. Coincidentally, since reaching this new milestone, Cardano is very close to completing an extremely important time cycle.
In Gann Analysis, Gann’s Cycles of the Inner Year are used to identify when markets may find new swing highs or lows. Previously, in March, we identified the 180-day cycle as having a high probability of reversing prices. Cardano did respond to the 180-day cycle in March by rallying nearly 60%.
For Cardano price, the third most powerful Cycle of the Inner Year (90-day is first, 180-day is second) is the 270-day cycle. 270-days from the all-time high on September 2, 2021, is May 30, 2022.
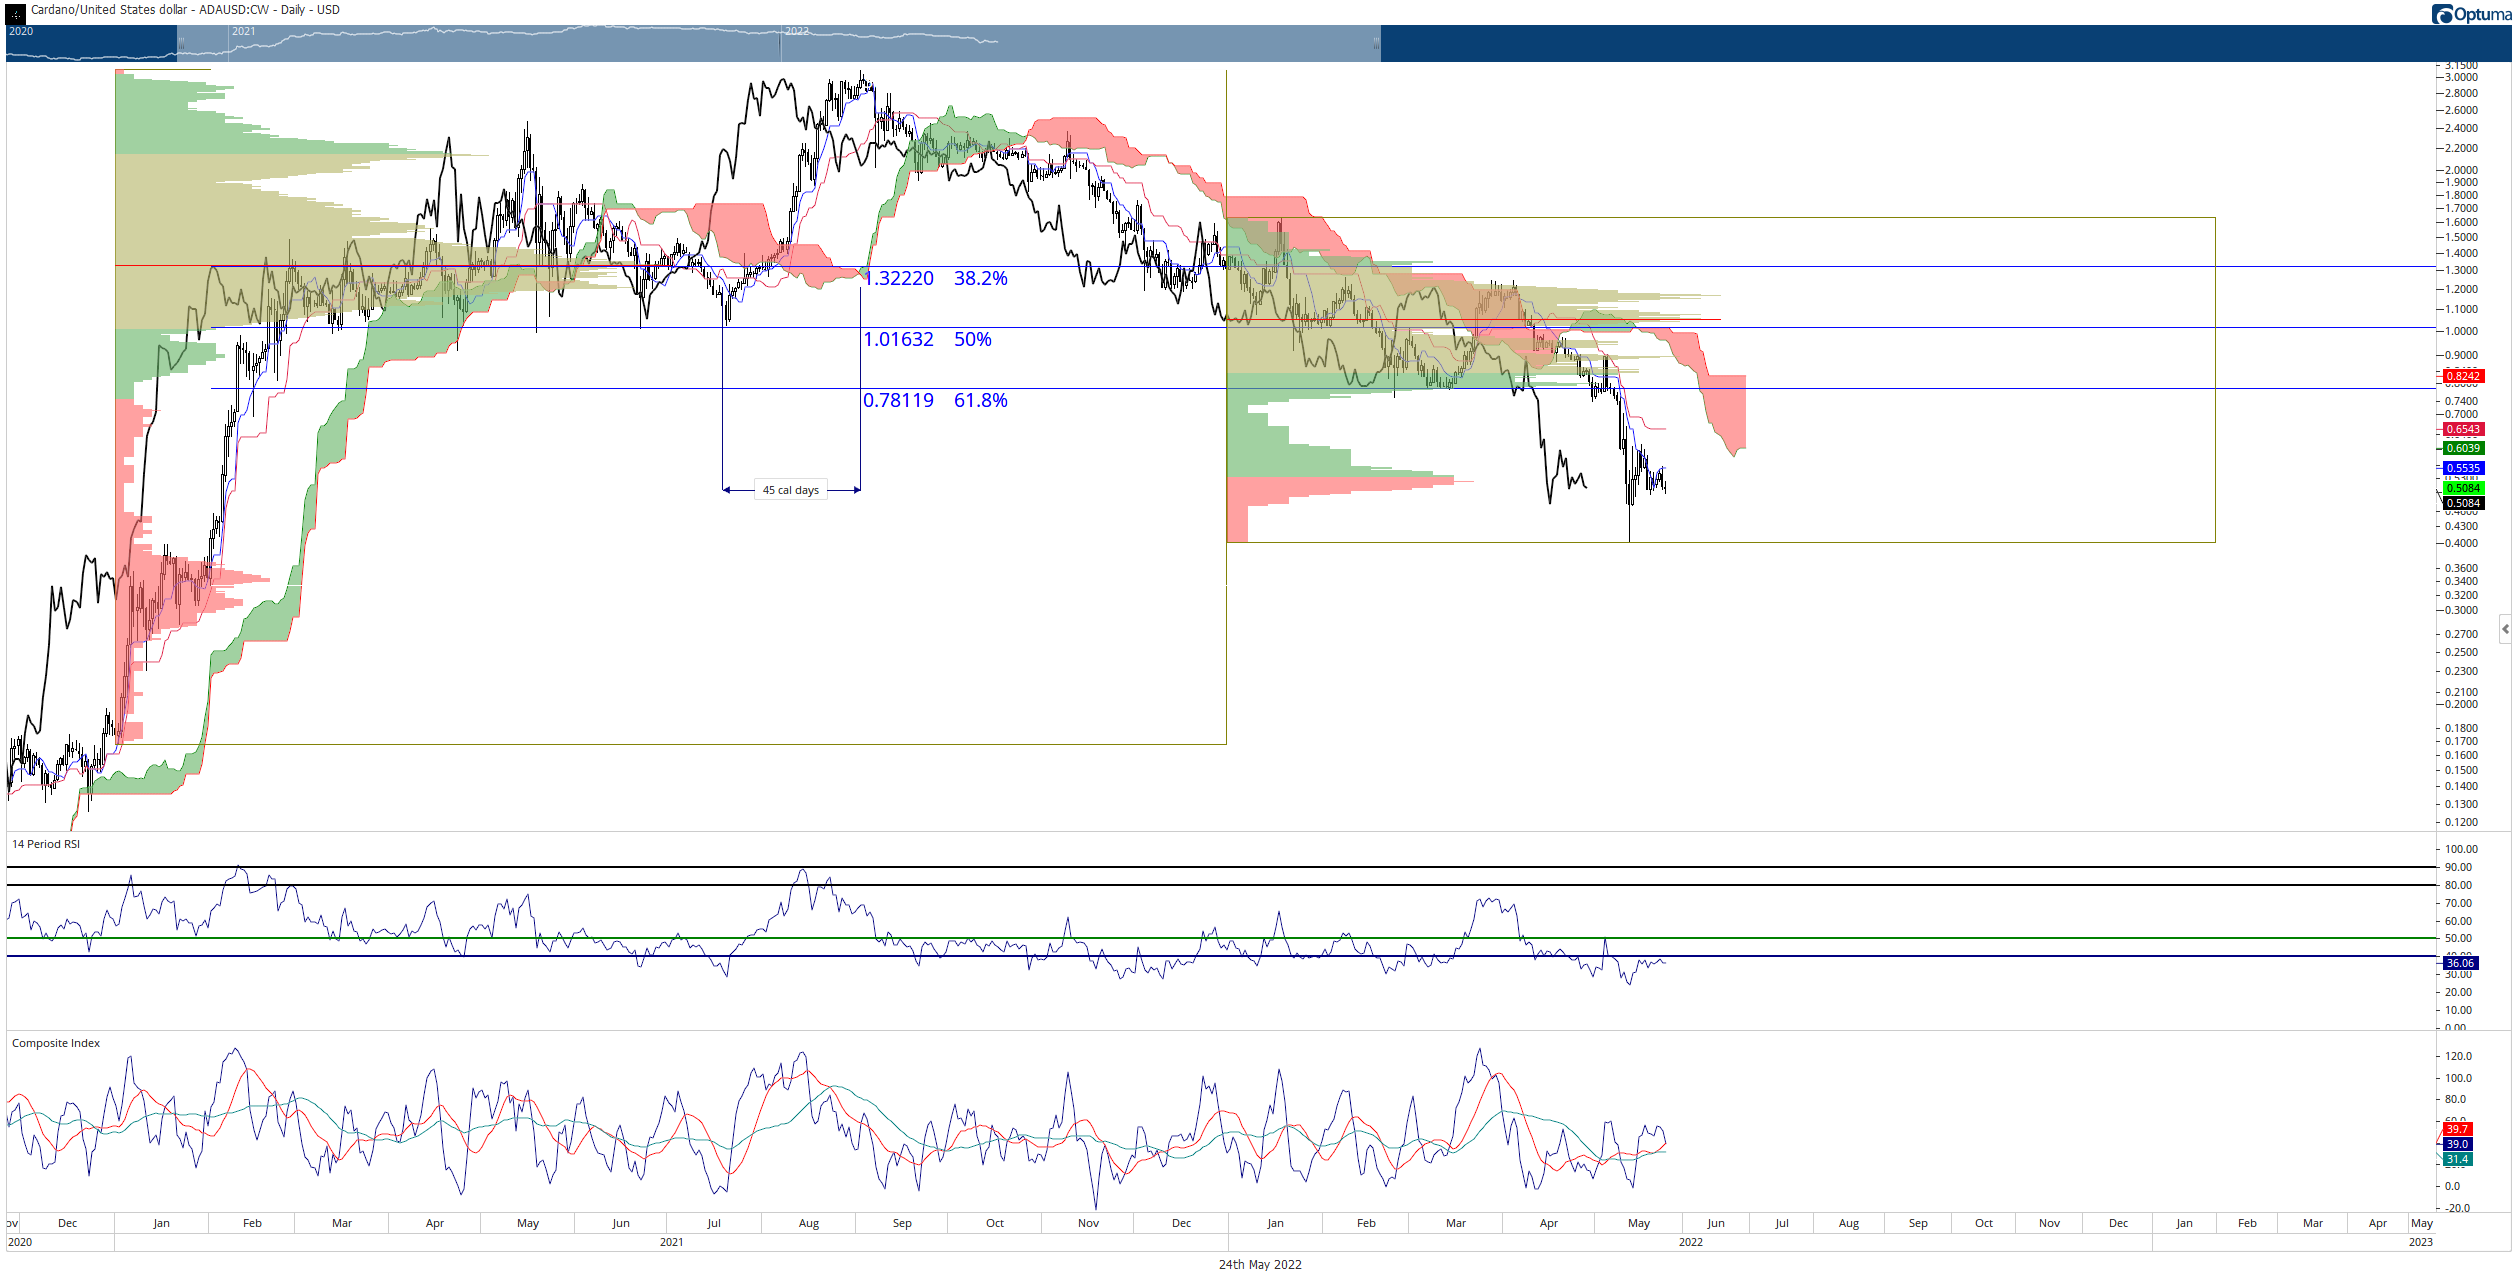
ADA/USD Daily Ichimoku Kinko Hyo Chart
From a price action perspective, ADA has developed a bearish pennant. A bearish pennant is a triangle that forms after or during a downtrend and is often a pause in trend before resuming another run lower. This would likely mean a 30% or greater drop towards the $0.35 to $0.30 value area for Cardano price.
$0.30 to $0.35 is an exceptionally powerful support zone. First, it is the low of the monthly strong bar in the Fibonacci retracement from the all-time high. Second, $0.30 is the 2021 Volume Point of Control, and $0.35 is the upper range of that high volume node. Cardano price action indicates that a return to the $0.30 – $0.35 range may be inevitable.


