
- Ethereum price shows a multi-year rising wedge formation forecasting a brutal crash.
- The theoretical target projects an ETH bottom around the $500 region, suggesting a 50% nosedive from the current levels.
- A different take also shows that the bottom for this cycle could be much lower.
Ethereum price performance has been extremely important in this cycle, considering the major paradigm shift that the ETH blockchain has created. From the 2020 DeFi Summer to NFTs, the smart contract token has been at the center of it all.
Perhaps, this is one of the reasons why many investors paid closer attention to Ethereum price than Bitcoin. Many popular fund managers and institutions even put out a statement saying that ETH will outperform BTC in the next cycle.
Considering the current market conditions, it is safe to say that the bull market that began in 2020 has ended. Furthermore, we are in a full-fledged bear market and things could get much worse.
In this article, we will look at Ethereum price from a purely technical perspective and address the elephant in the room – a multi-year rising wedge formation that forecasts a catastrophic crash.
Ethereum price and its intricacies
Ethereum price has been on an uptrend since October 2015 and generated 93,093% in returns as of today. A macro outlook shows that ETH has set up three higher highs and two higher lows, with the third one almost forming.
Drawing trend lines connecting the swing highs and swing lows reveal the formation of a rising wedge pattern. This technical formation has a bearish bias. But unlike the usual technical analysis, let’s get down into the details of a rising wedge, what it means, and how to trade it.
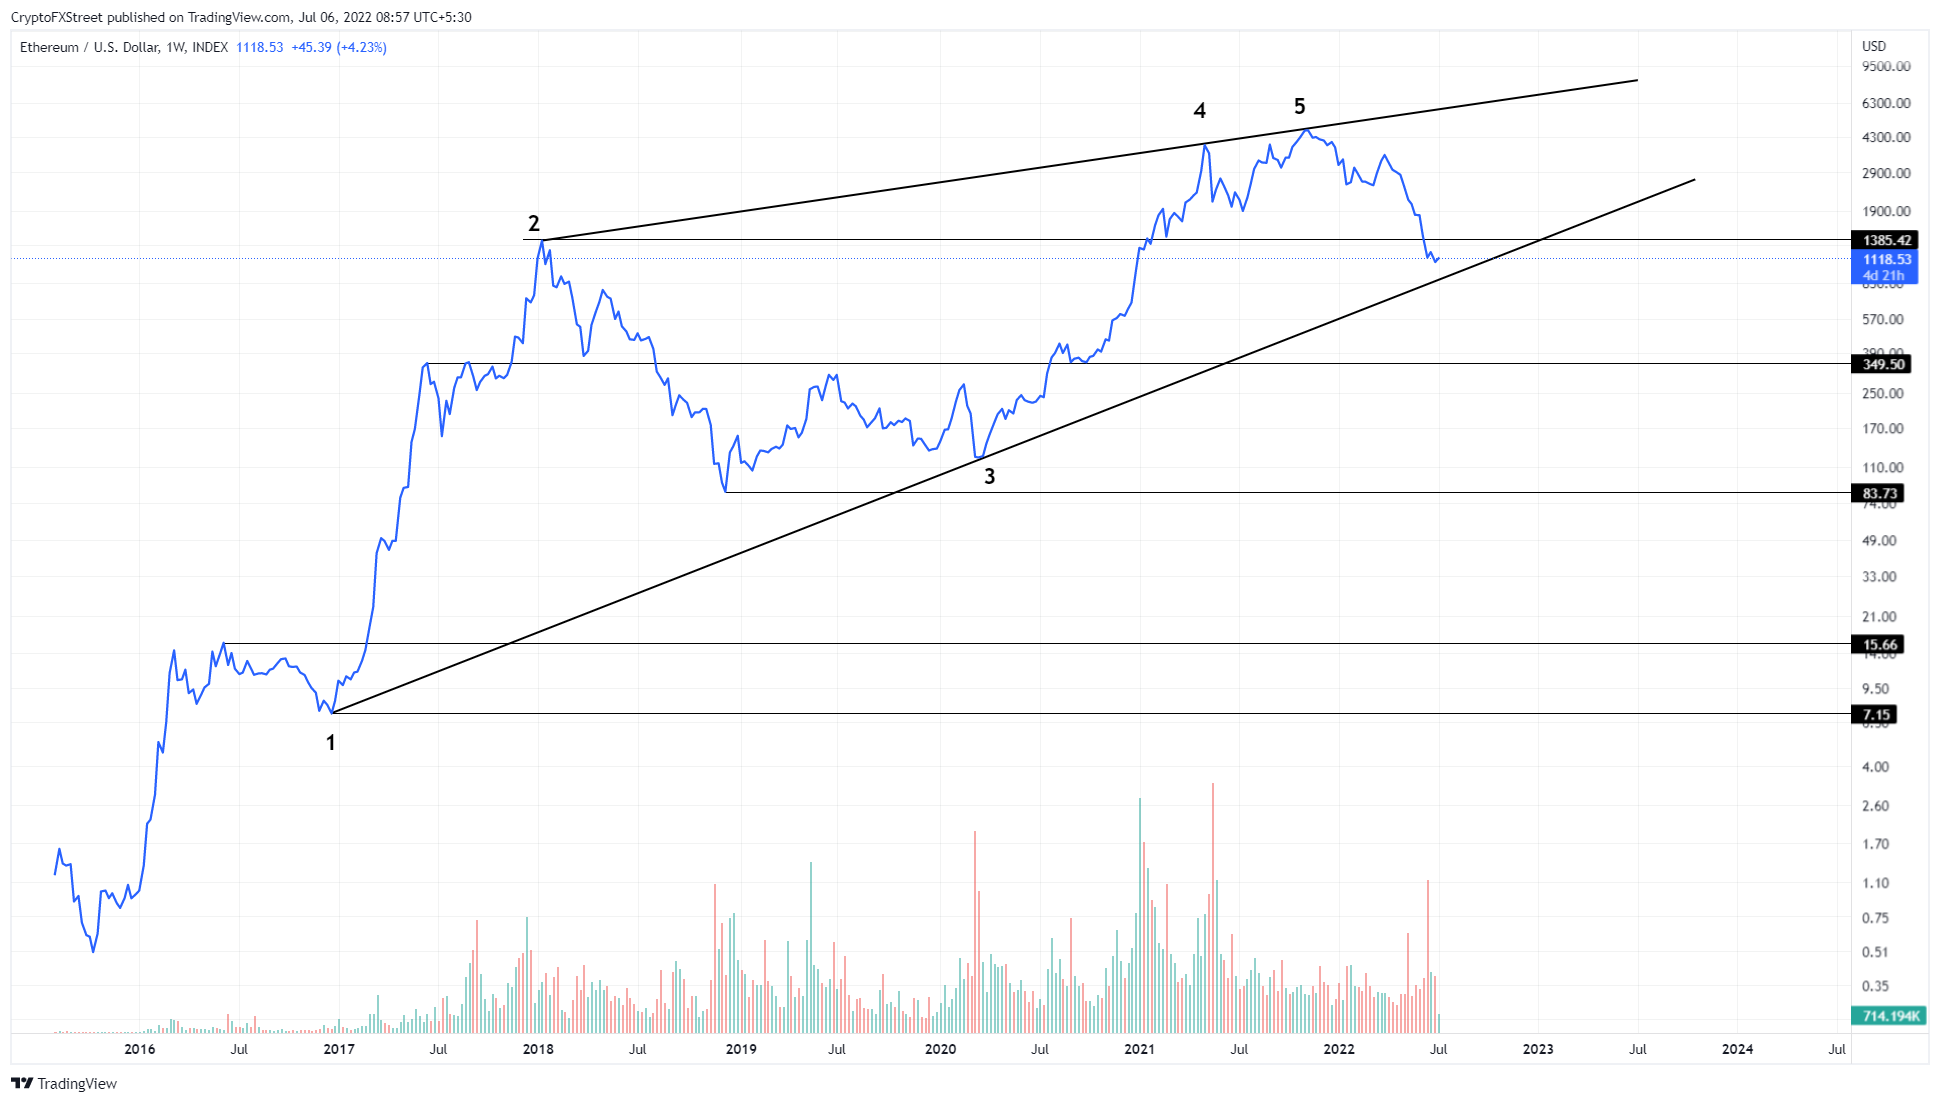
ETH/USDT 1-week chart
Rising Wedge and its characteristics
We are going to refer to Thomas N. Bulkowski and his Encyclopedia of Chart Patterns book for this purpose.
A Rising Wedge, according to Bulkowski, is “an upward price spiral bounded by two intersecting, up-sloping trend lines.” Based on Bulkowski’s book, this formation can break upwards or downwards. The probability of the direction depends on underlying market conditions i.e., bull or bear market.
- In bull markets, an upward breakout occurs 18 out of 23 times and 17 out of 19 times in bear markets.
- In bull markets, a downward breakout occurs 20 out of 21 times and 21 out of 21 in bear markets.
Bukowski further defines the Identification Guidelines for Rising Wedges, which are as follows.
- Two sloping trend lines – one connecting the swing highs and the other swing lows.
- Multiple touches – there should be at least three touches on one side and two touches on the other side.
- Three-week duration – the wedge formation must happen over at least three weeks.
- Volume trend – usually, the volume tends to decline.
As shown in the chart above, Ethereum has produced three touches to the trend line connecting the swing high and two touches to the trend line connecting swing lows, which checks the first and second guidelines.
The third guideline is satisfied but can be ignored because cryptocurrencies have a much shorter cycle as compared to stocks.
The volume trend for Ethereum price is not declining, but it can be ignored. Thomas N. Bulkowski states that,
Most of the time, volume trends downward and becomes especially low just before the breakout. However, this is not an absolute rule. If you suspect a wedge but it has a rising volume trend, then ignore the volume trend. Review the other guidelines (especially the number of touches) to make sure the chart pattern resembles a rising wedge.”
In conclusion, this technical formation aligns with all the guidelines stipulated by the author. Now that we’ve established that Ethereum price is in a rising wedge, let’s take a look at factors like the target, measurement rule and others.
Targets for Rising Wedge
The book notes that, for a downward breakout, the price should decline to the start of the formation. In this case, it suggests that Ethereum price should, technically, drop to $7.15, which is absurd.
Alternatively, Bulkwoski also recommends measuring the height of the rising wedge and multiplying that number by the percentage price meeting target of 32%. Adding this number to the breakout point gives us the target.
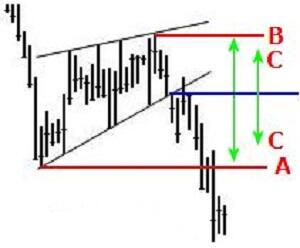
Rising Wedge Measure Rule
- In ETH’s case, the distance between the highest peak and lowest valley is 99.85%.
- Multiplying 99.85 by 32% gives a result of 31.952%.
Although the breakout has not occurred yet, we can speculate that a breakdown of the $800 psychological support level will produce a weekly candlestick close below the rising wedge’s lower trend line.
Now, measuring roughly 32% from the $800 level reveals a target of $544.
If this outlook plays out, Ethereum price could crash another 50% from the current position before reaching its theoretical target at $544., This level could be where the altcoin bottoms for this cycle, at least based on the rising wedge pattern conditions.
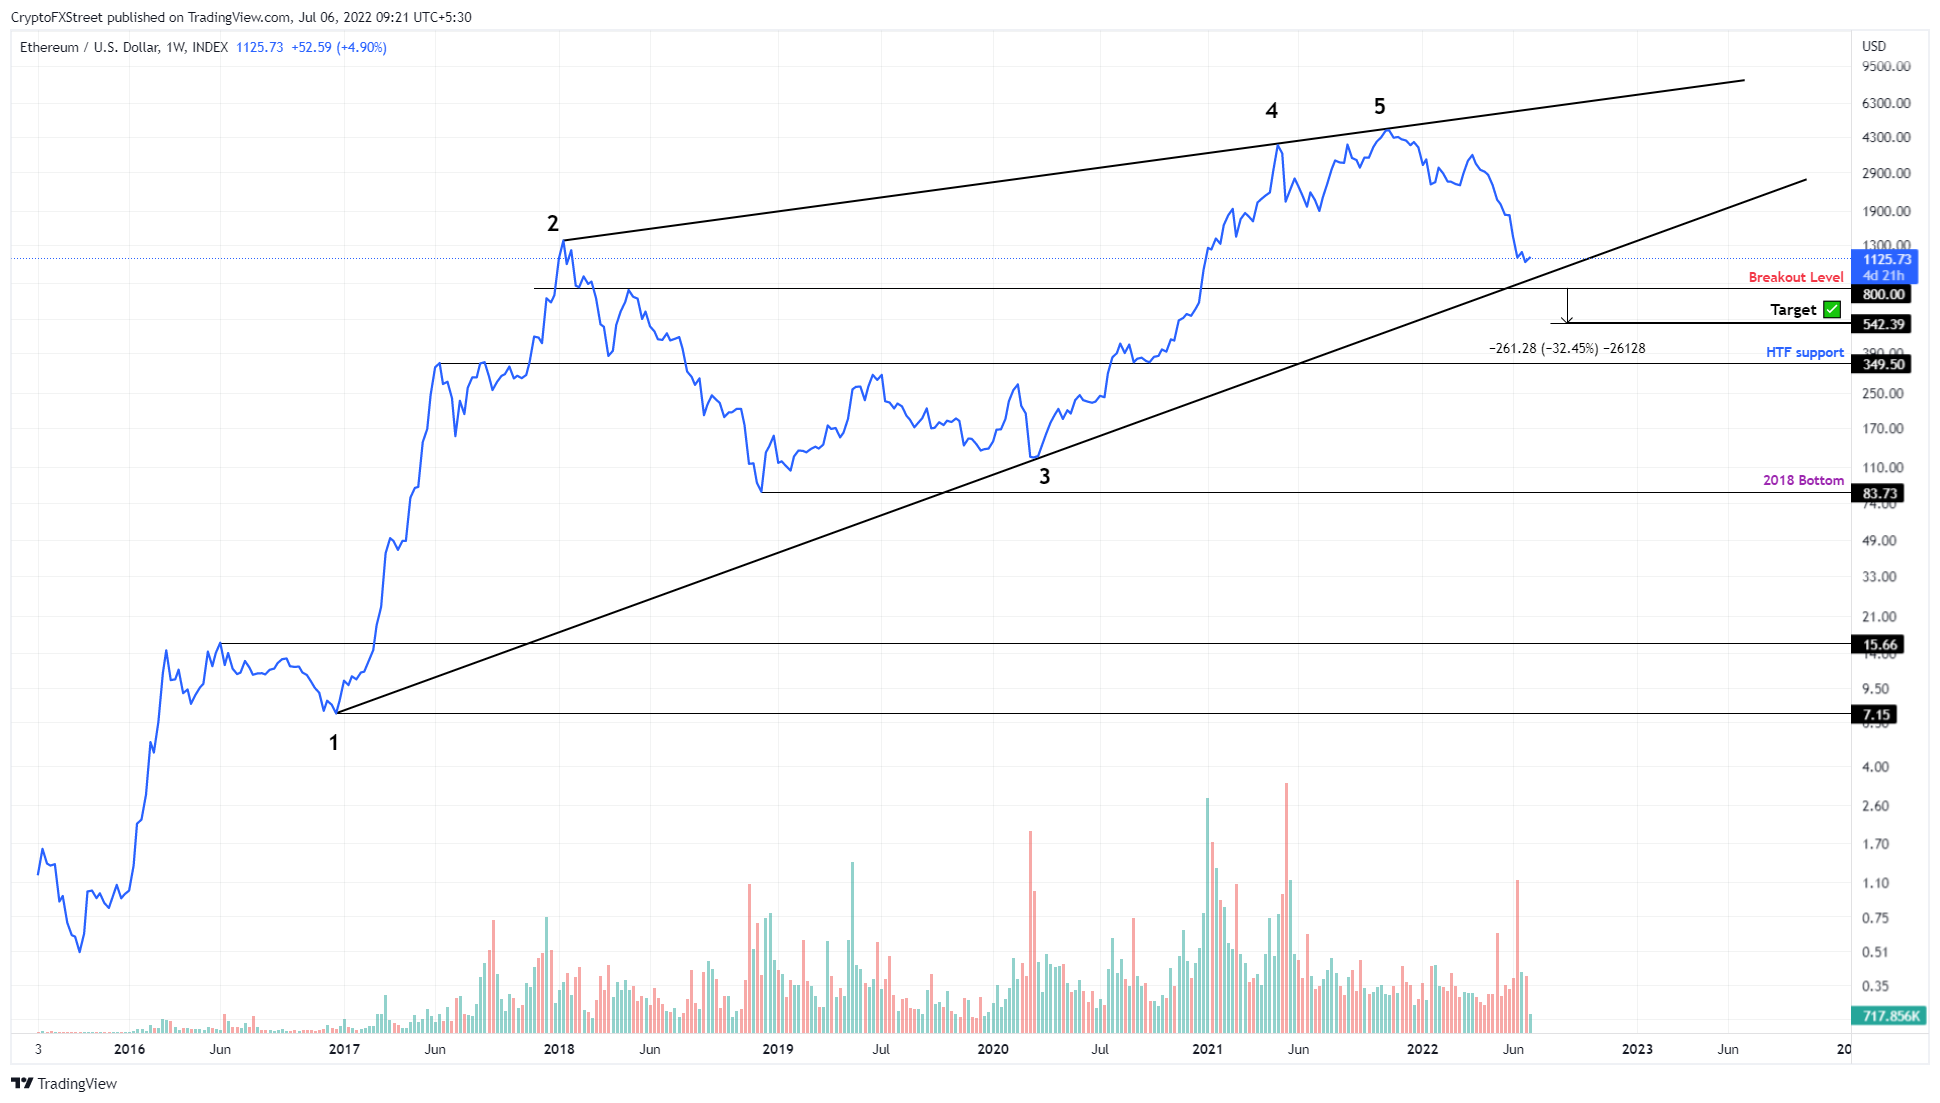
ETH/USD 1-week chart
Ethereum price bottom and concluding thoughts
A 50% crash in Ethereum price is not something that is unlikely. Considering the worsening macroeconomic and geopolitical conditions, and the threat of a looming recession, a 50% discount in cryptocurrency prices is not outside the realm of possibility.
However, a close look at the Ethereum price chart with volume profiles shows that there is a void or inefficiency extending from $964 to $383. A breakdown of the $661 support level could trigger a further crash to $383.
Hence, investors should be aware of a scenario where ETH could lose 65% of its current market value.
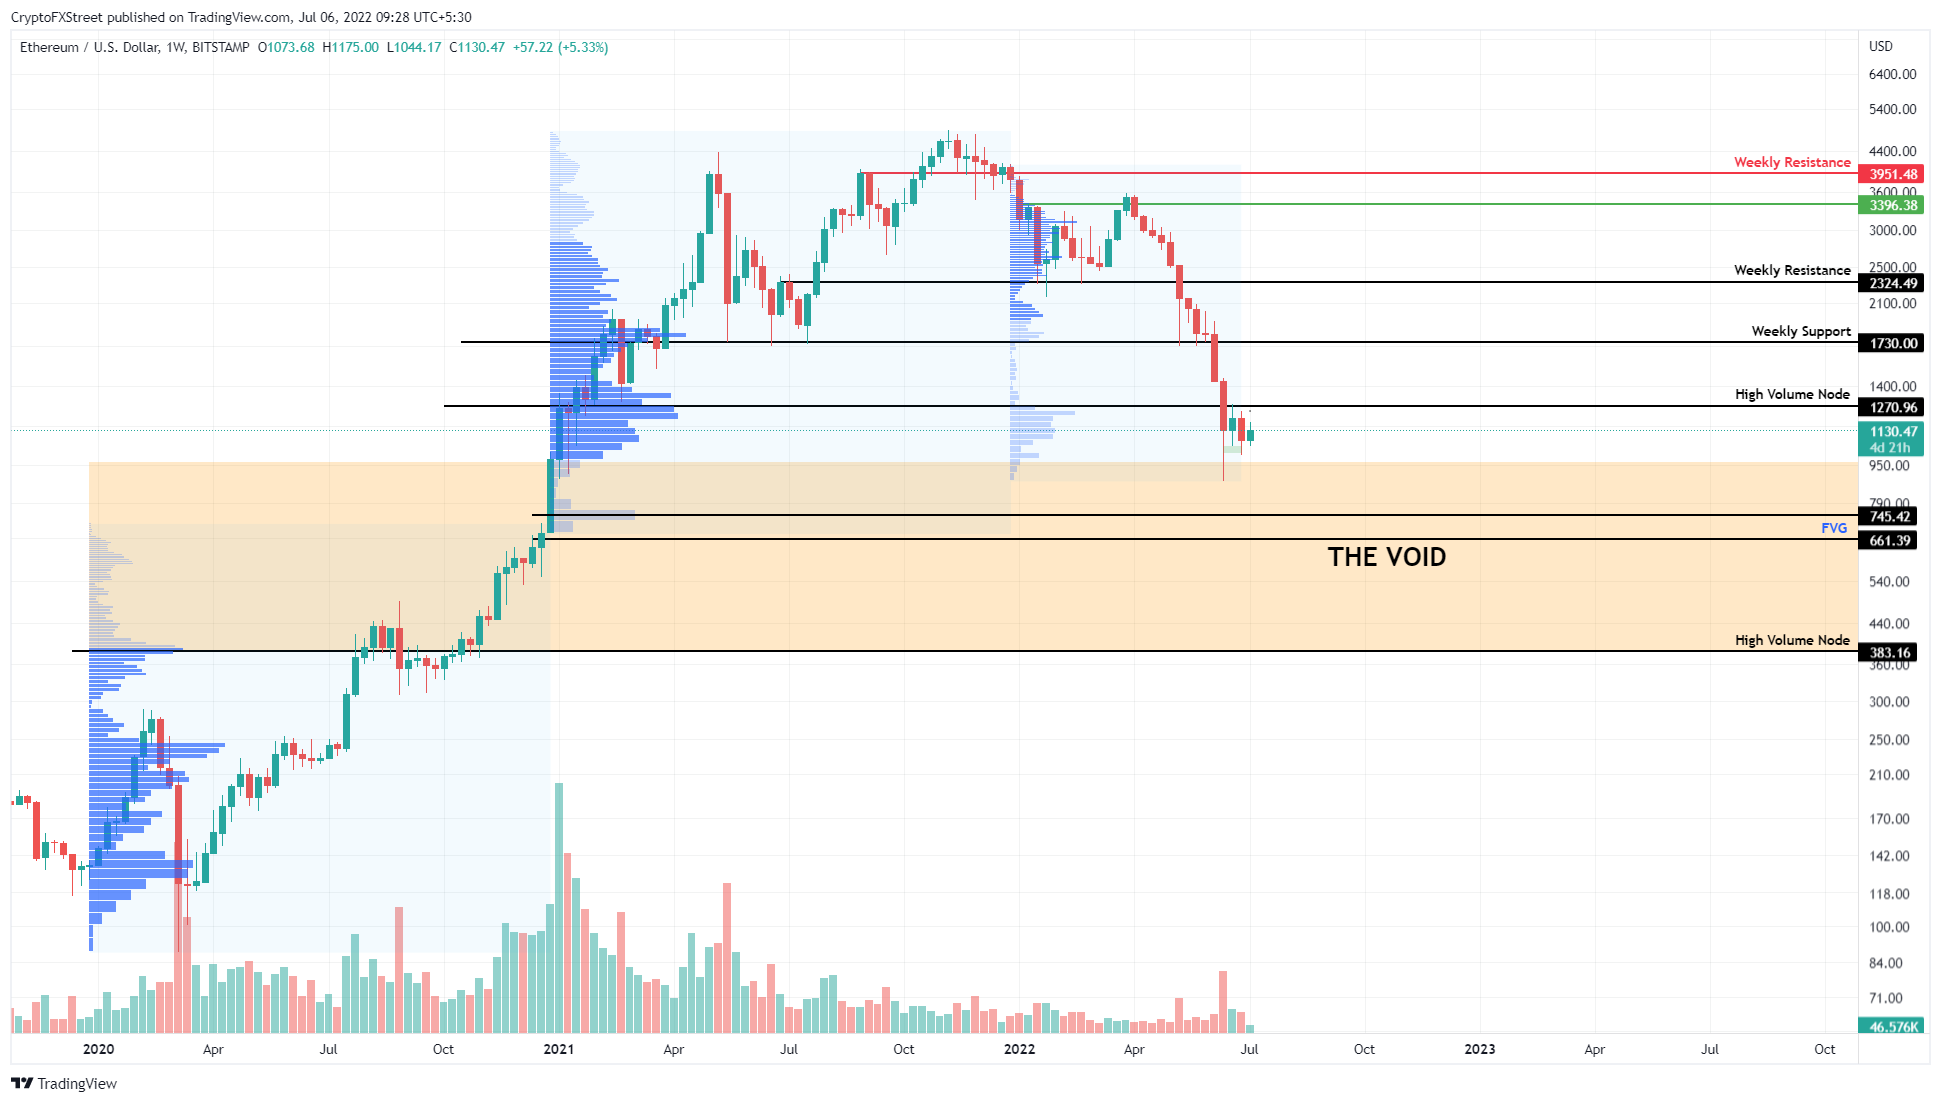
ETH/USD 1-week chart
The only way this bearish outlook can be undone for the Ethereum price would be a bounce from the $950 support level followed by a weekly candlestick close above $3,400. This move would produce a higher high relative to the swing high formed on March 28.
Although unlikely, such a development would be the start of a new trend. In such a case, market participants can expect ETH to produce a higher low relative to the June 13 swing low at $880.


