
- Ethereum price rallied more than 18% last week.
- Weekly close was above key Fibonacci and Ichimoku levels.
- Near-term resistance ahead could cause a pullback.
Ethereum price had a spectacular performance last week, chiefly over Friday and Saturday. The result of an 18% gain saw the high of last week equal the close, creating an exceptionally bullish candlestick while also displaying clear bullish sentiment.
Ethereum price positioned for its next stop and major resistance test at $3,500
Ethereum price has its first major resistance test coming up soon. There is a confluence zone of resistance with the 38.2% Fibonacci retracement, extended 2021 Volume Point Of Control, and the Tenkan-Sen at $3,300. The level at $3,300 represents the most substantial resistance since the 50% Fibonacci retracement at $2,900 and the first significant resistance since bulls denied bears the Ideal Bearish Ichimoku Breakout they were looking for two weeks ago.
Bulls should not have difficulty pushing Ethereum above $3,300 to the next and final resistance level at the Kijun-Sen ($3,500). The Relative Strength Index remains in bull market conditions and is between the two oversold levels of 40 and 50, with support having been found at 40. Likewise, the Optex Bands oscillator remains in extreme oversold conditions, the lowest and longest level it’s been at since 2018. Finally, the Composite Index shows a bullish crossover of its fast-moving average occurring this week.
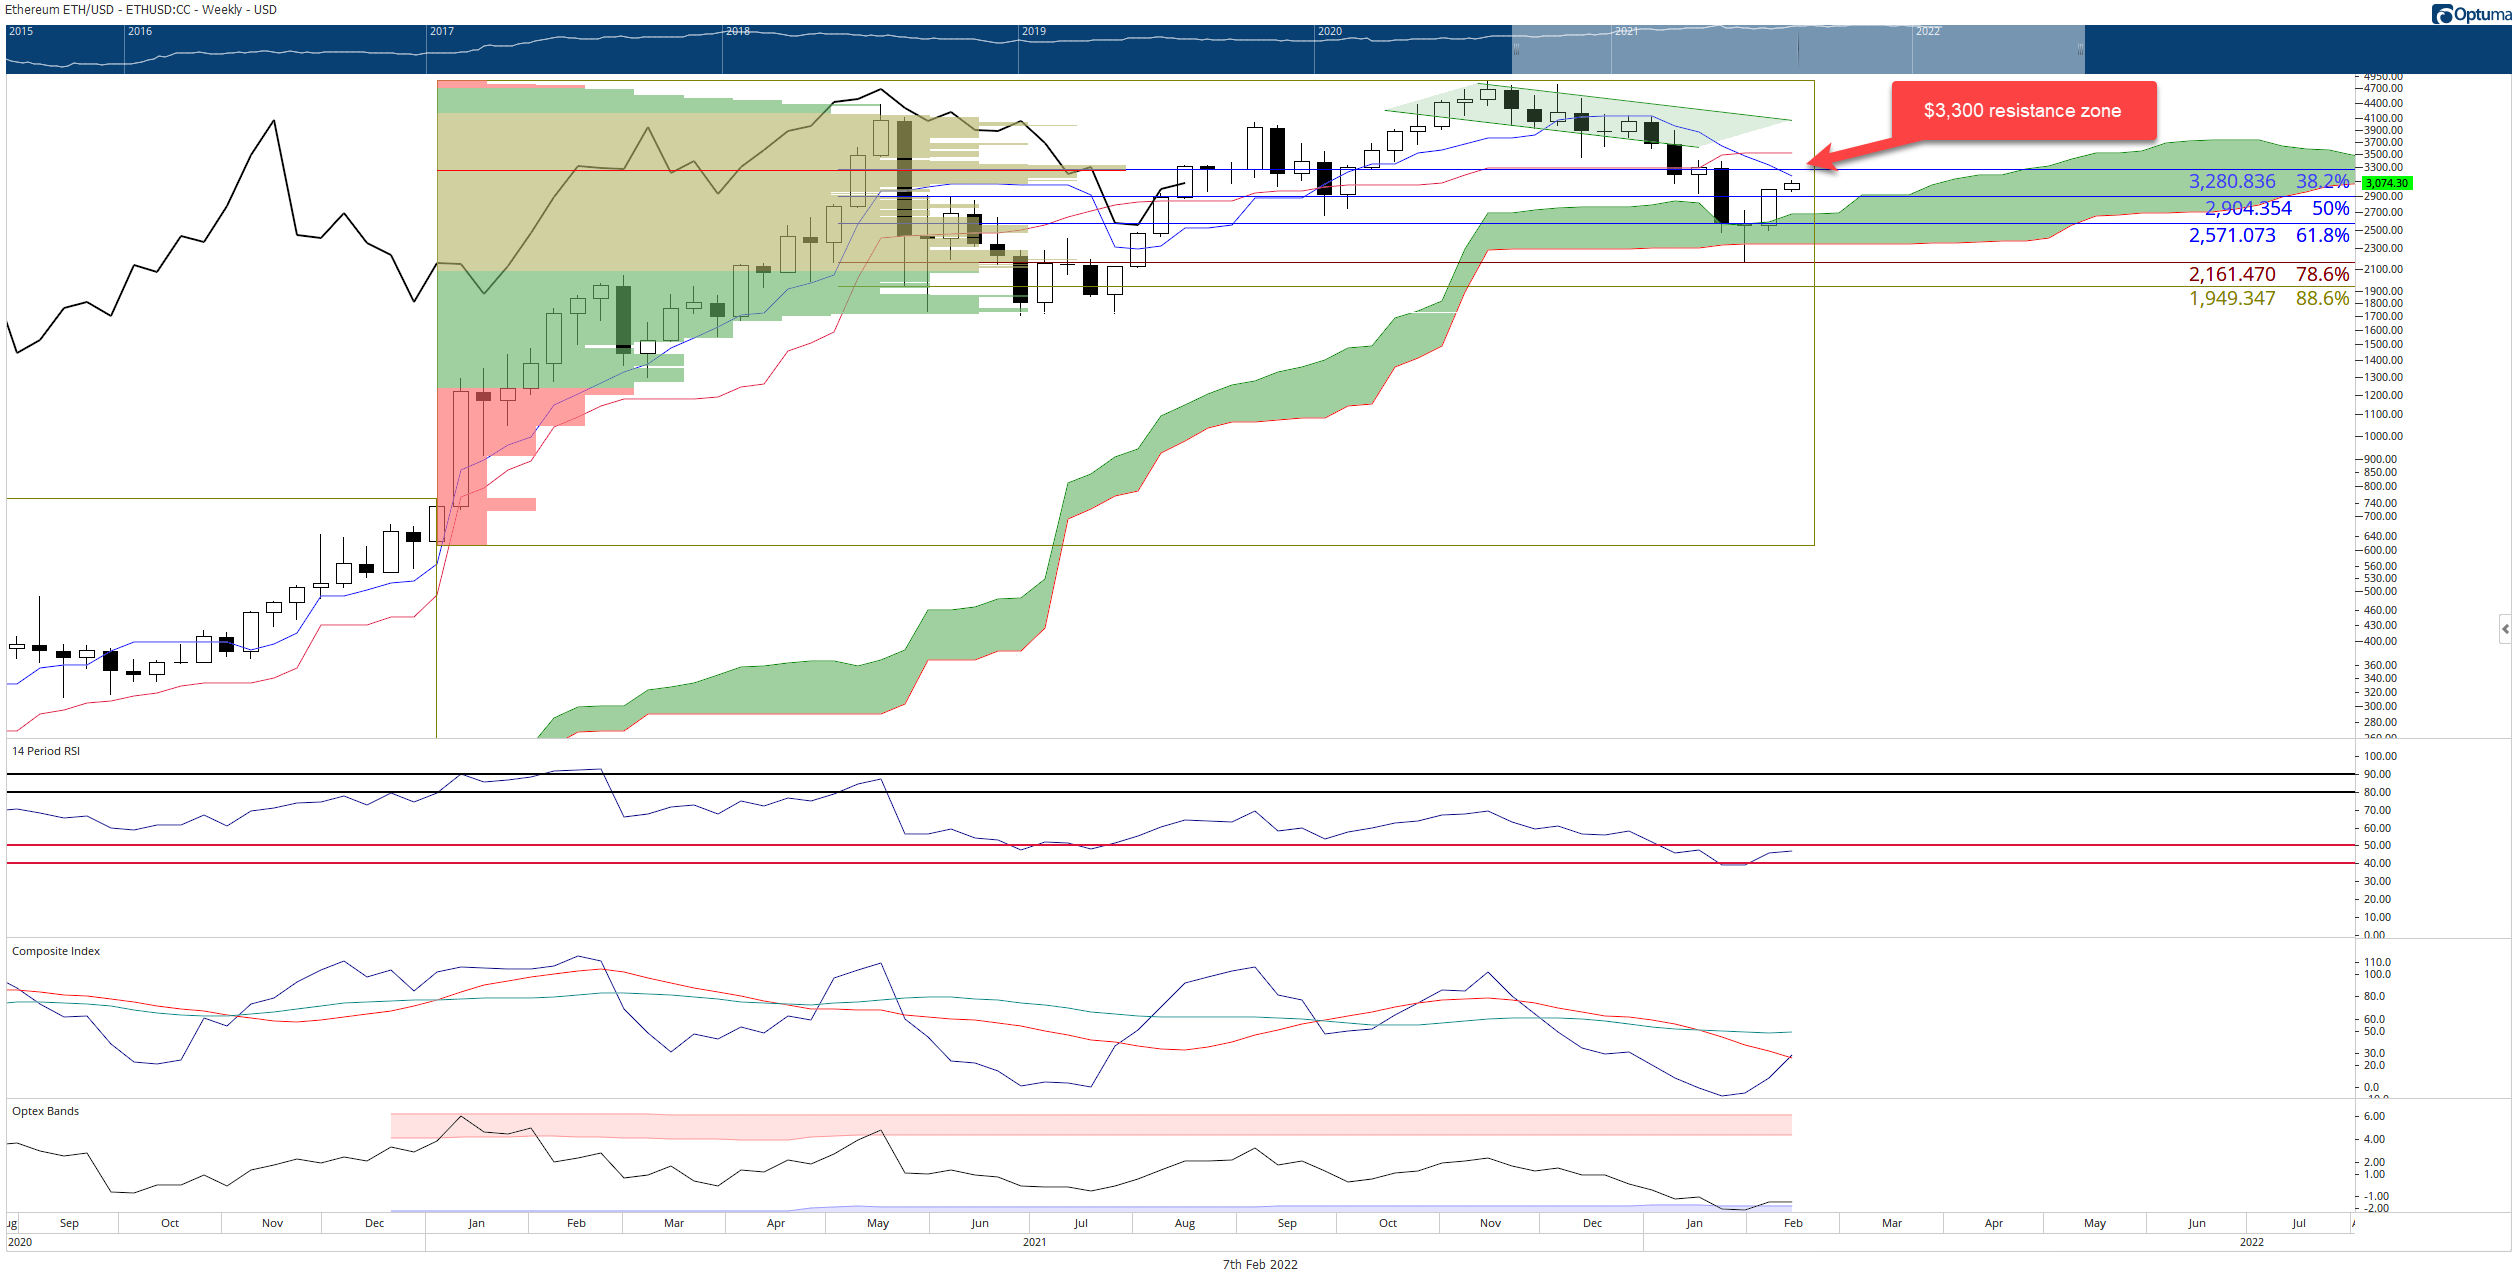
ETH/USD Weekly Ichimoku Kinko Hyo Chart
Upside potential this week could be limited to the $3,500 value area. However, there is a strong possibility of some flat price action and even a moderately bearish close for this week as traders pause and reflect after a significant move from last week. A retracement to retest the 50% Fibonacci retracement at $2,900 is highly probable.


