
- Ethereum price has sliced through the 200-day SMA at $3,437 and dipped to $2,927.
- Investors can expect ETH to rally 18% to retest $3,600 as it consolidates above the weekly support level.
- A daily candlestick close below $2,550 will invalidate the bullish thesis.
Ethereum price has continued its decline over the last week after dipping below a crucial psychological level. But short-sellers beware – this downswing may be a necessary prerequisite to set the scene for a bullish recovery to play out. The new week holds out the tantalizing promise, therefore, that a shift in trend may be happening favoring bulls.
Ethereum price ready for a recovery rally
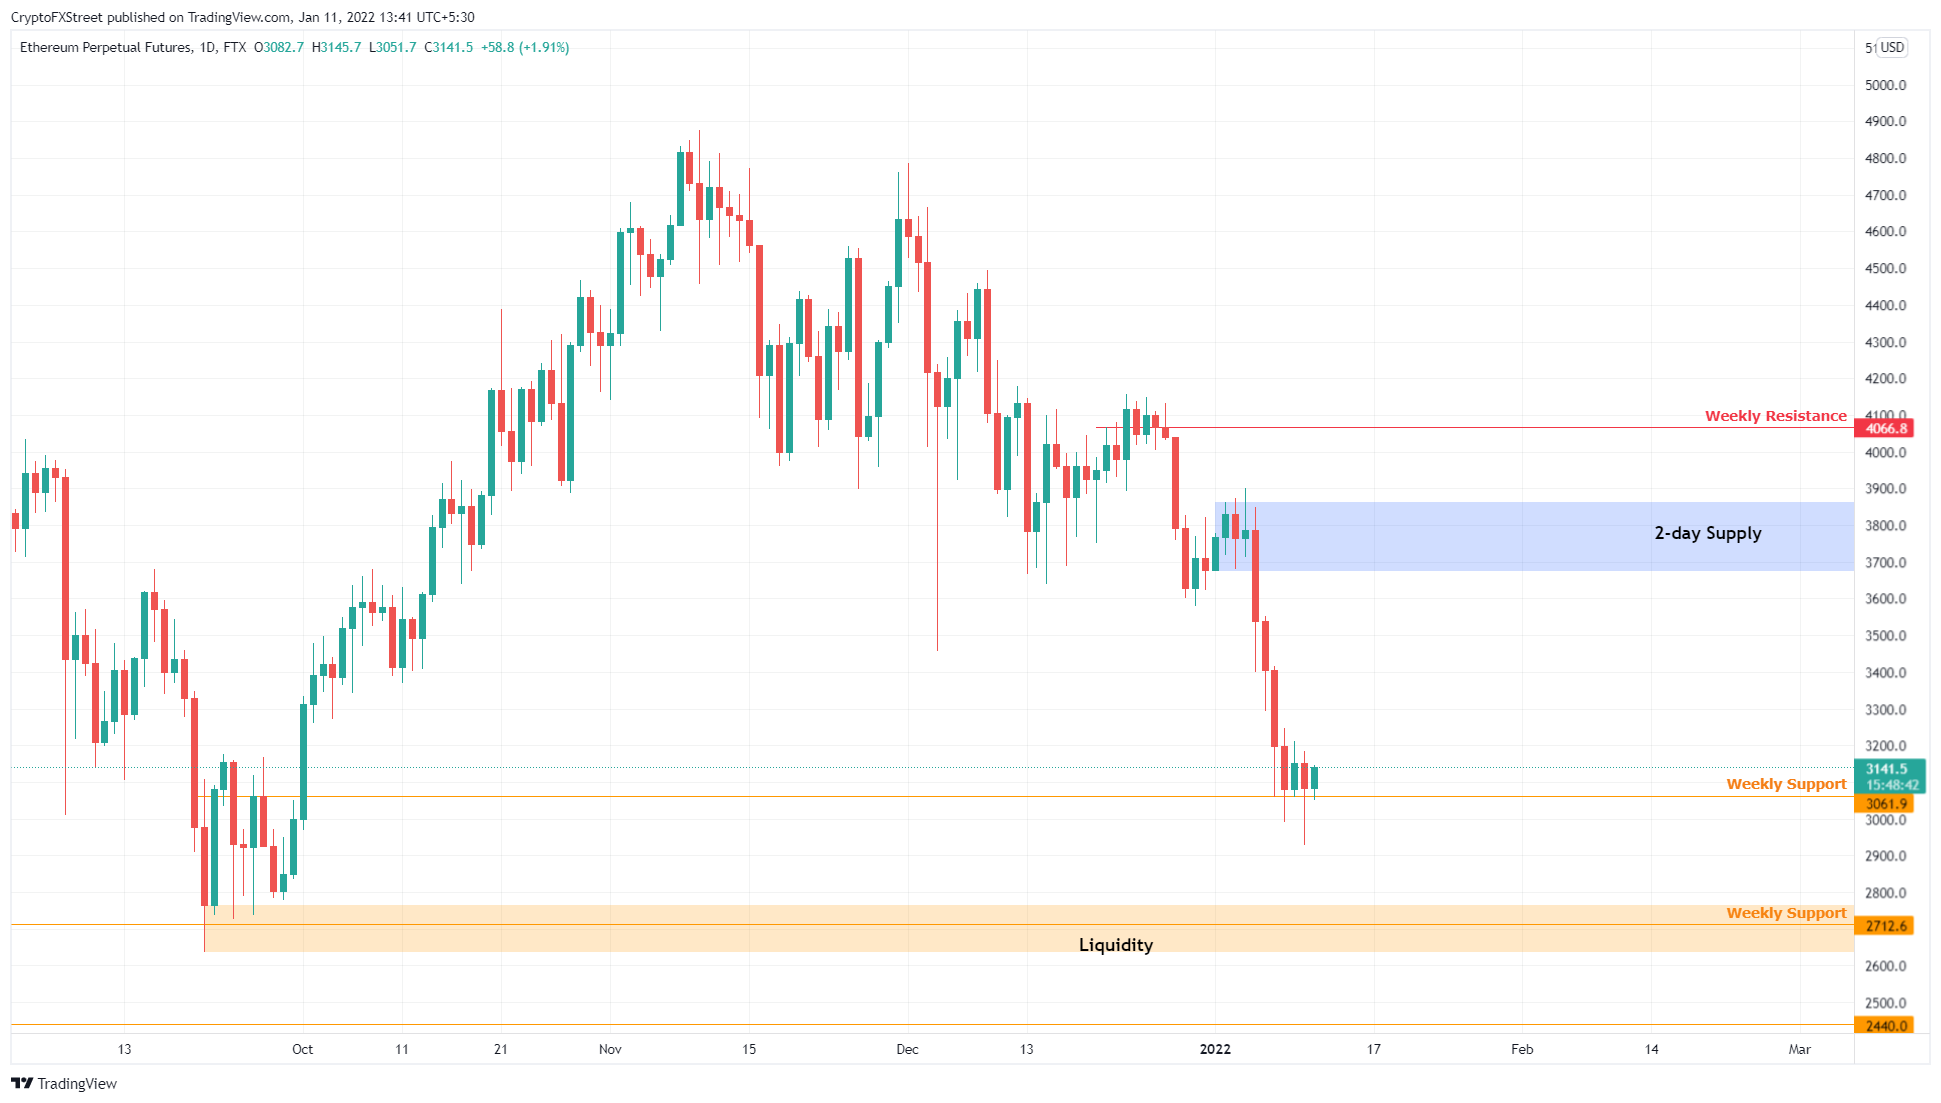
Ethereum price dropped 22% since January 1, shattering the 200-day Simple Moving Average (SMA) at $3,437 and setting a swing low at $2,927. The move exhausted selling pressure and marked a temporary bottom for the altcoin.
Since then, Ethereum price has recovered above weekly support at $3,061 and is currently consolidating around that level. Market participants can expect an increase in buying pressure, propelling ETH to flip the 200-day SMA into a support floor and revisiting the 2-day supply zone, extending from $3,675 to $3,862.
In total, this run-up would constitute a 22% gain for Ethereum price from its current position. While unlikely, ETH could mow through the said supply zone and make a run for the weekly resistance barrier at $4,068, where the 50-day SMA has crossed below 100-day SMA, developing a death cross. This move would bring the total gain to 30%.
ETH/USDT 1-day chart
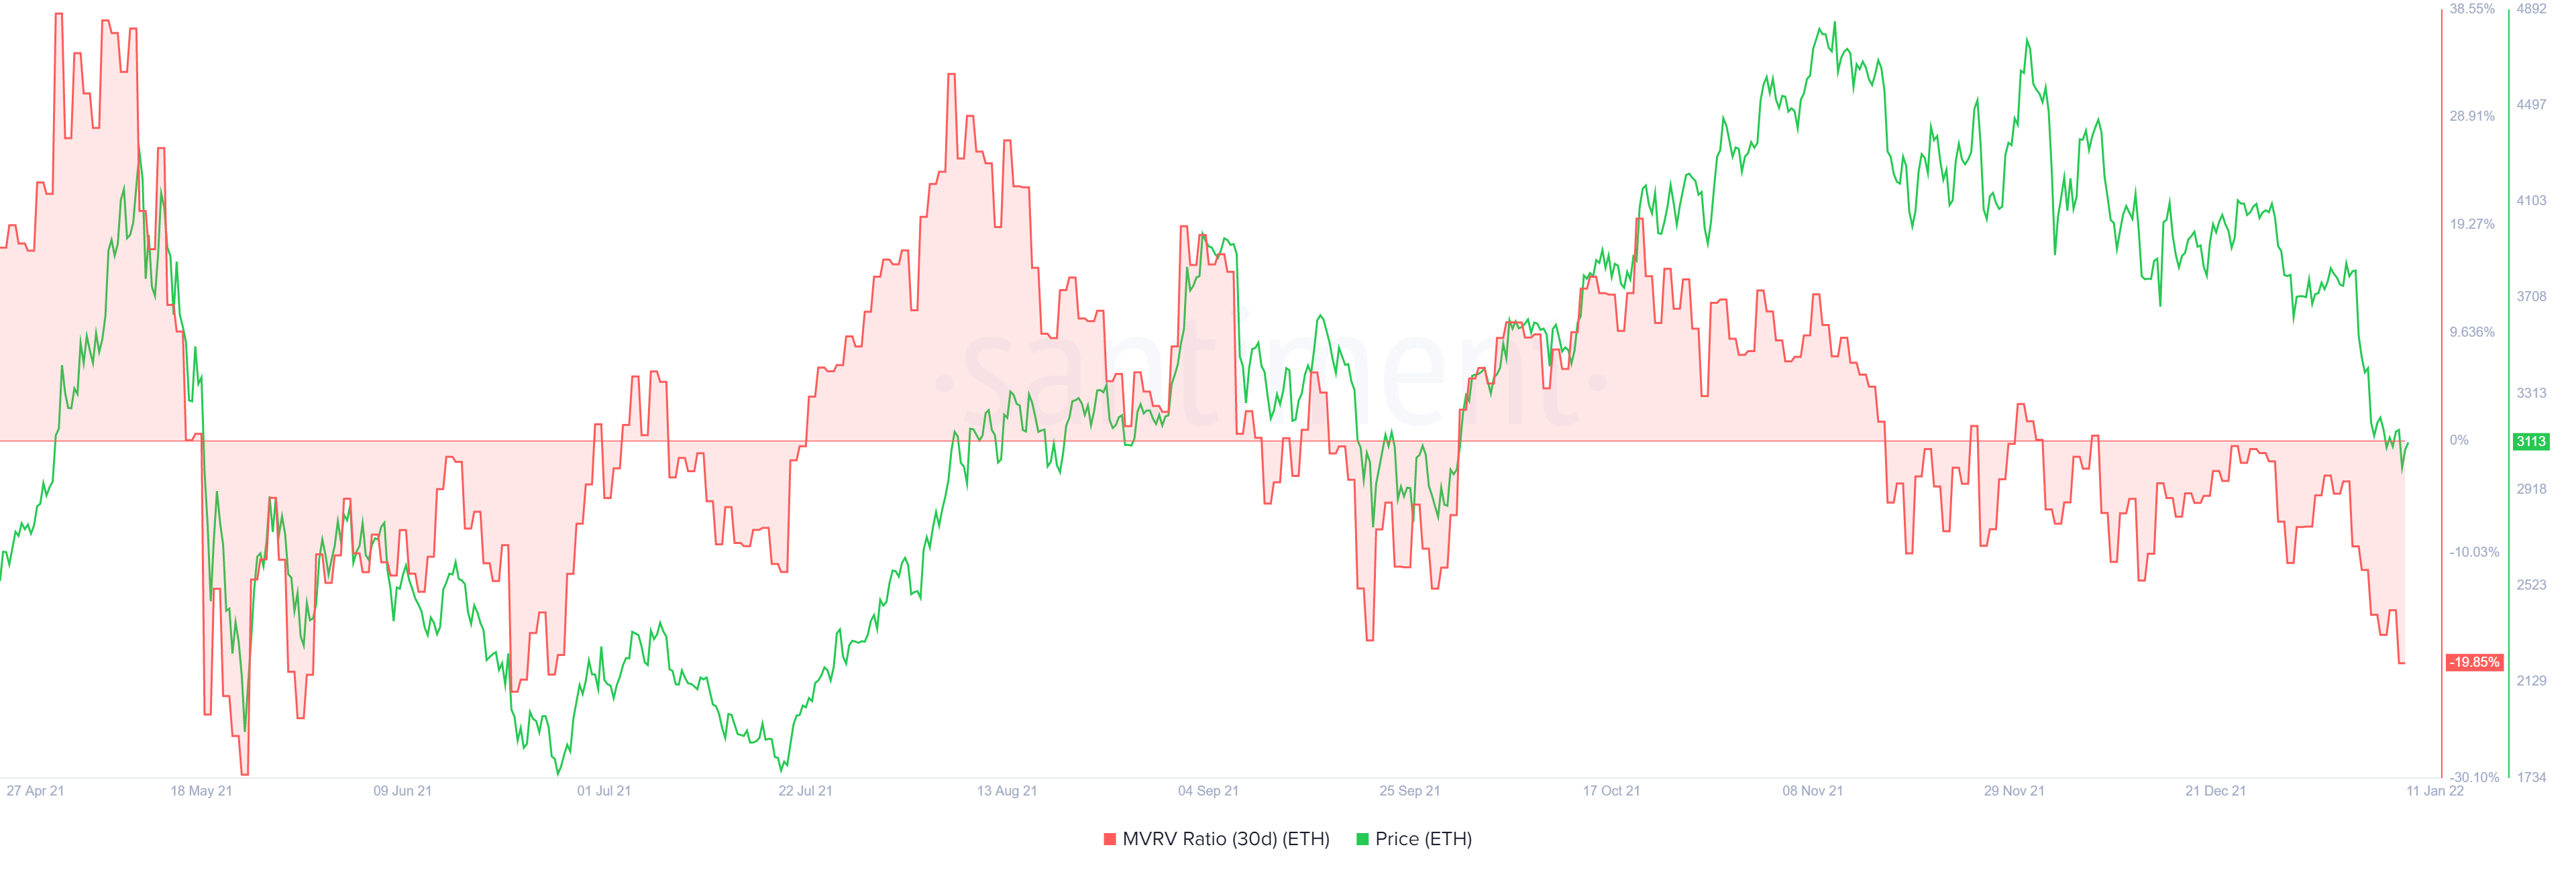
Supporting this short-term bullish outlook for Ethereum price is Santiment’s 365-day Market Value to Realized Value (MVRV) model This on-chain metric is used to determine the average profit/loss of investors that purchased ETH over the past year.
This index currently reads -15.2%, revealing that these holders are underwater and are less likely to contribute to the selling pressure. Interestingly, data shows that this is the opportunity zone, where long-term buyers tend to accumulate.
This could indicate ETH is ready for a quick move higher.
ETH 365-day MVRV
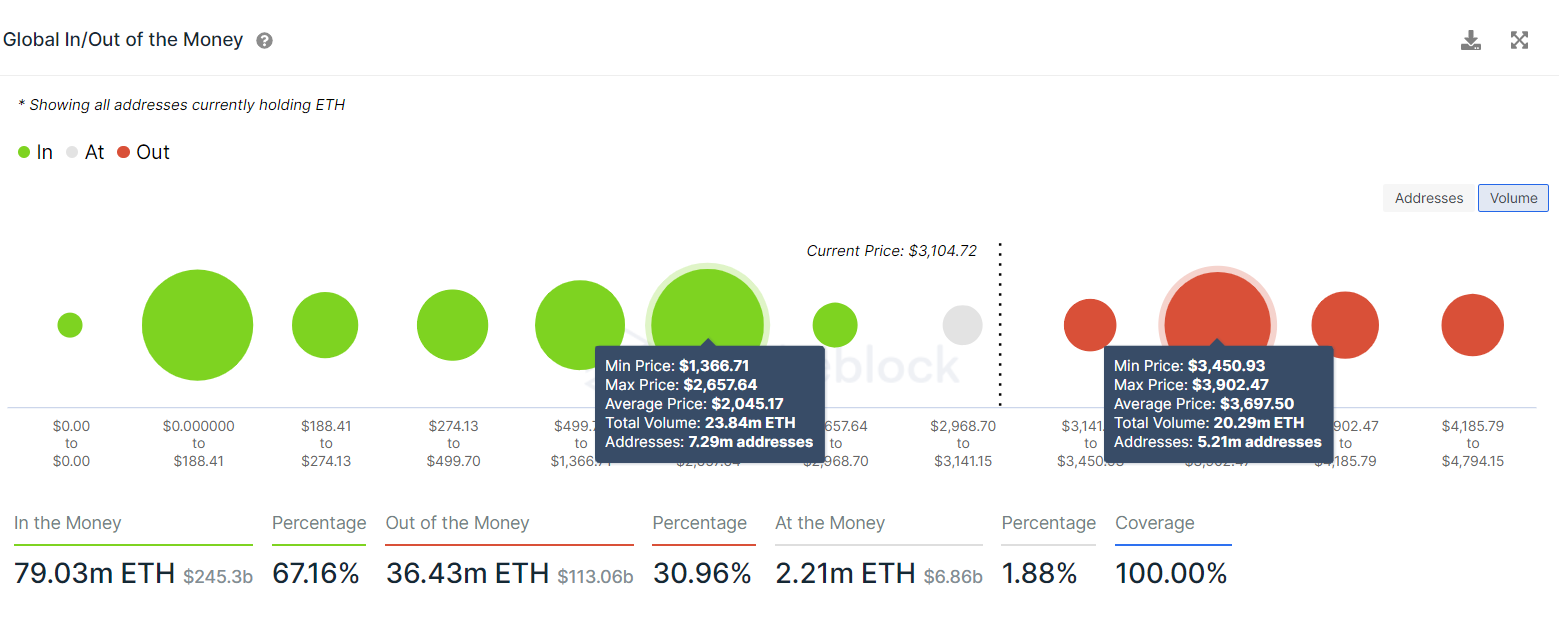
Another indicator, IntoTheBlock’s Global In/Out of the Money (GIOM) model shows that Ethereum price has a resistance-free path up to $3,600, suggesting ETH can easily climb higher to retest that level.
Roughly 5.12 million addresses that purchased 20.29 million ETH tokens at an average price of $3,697 are underwater. Therefore, any short-term rallies are likely to face a blockade around this barrier.
ETH GIOM
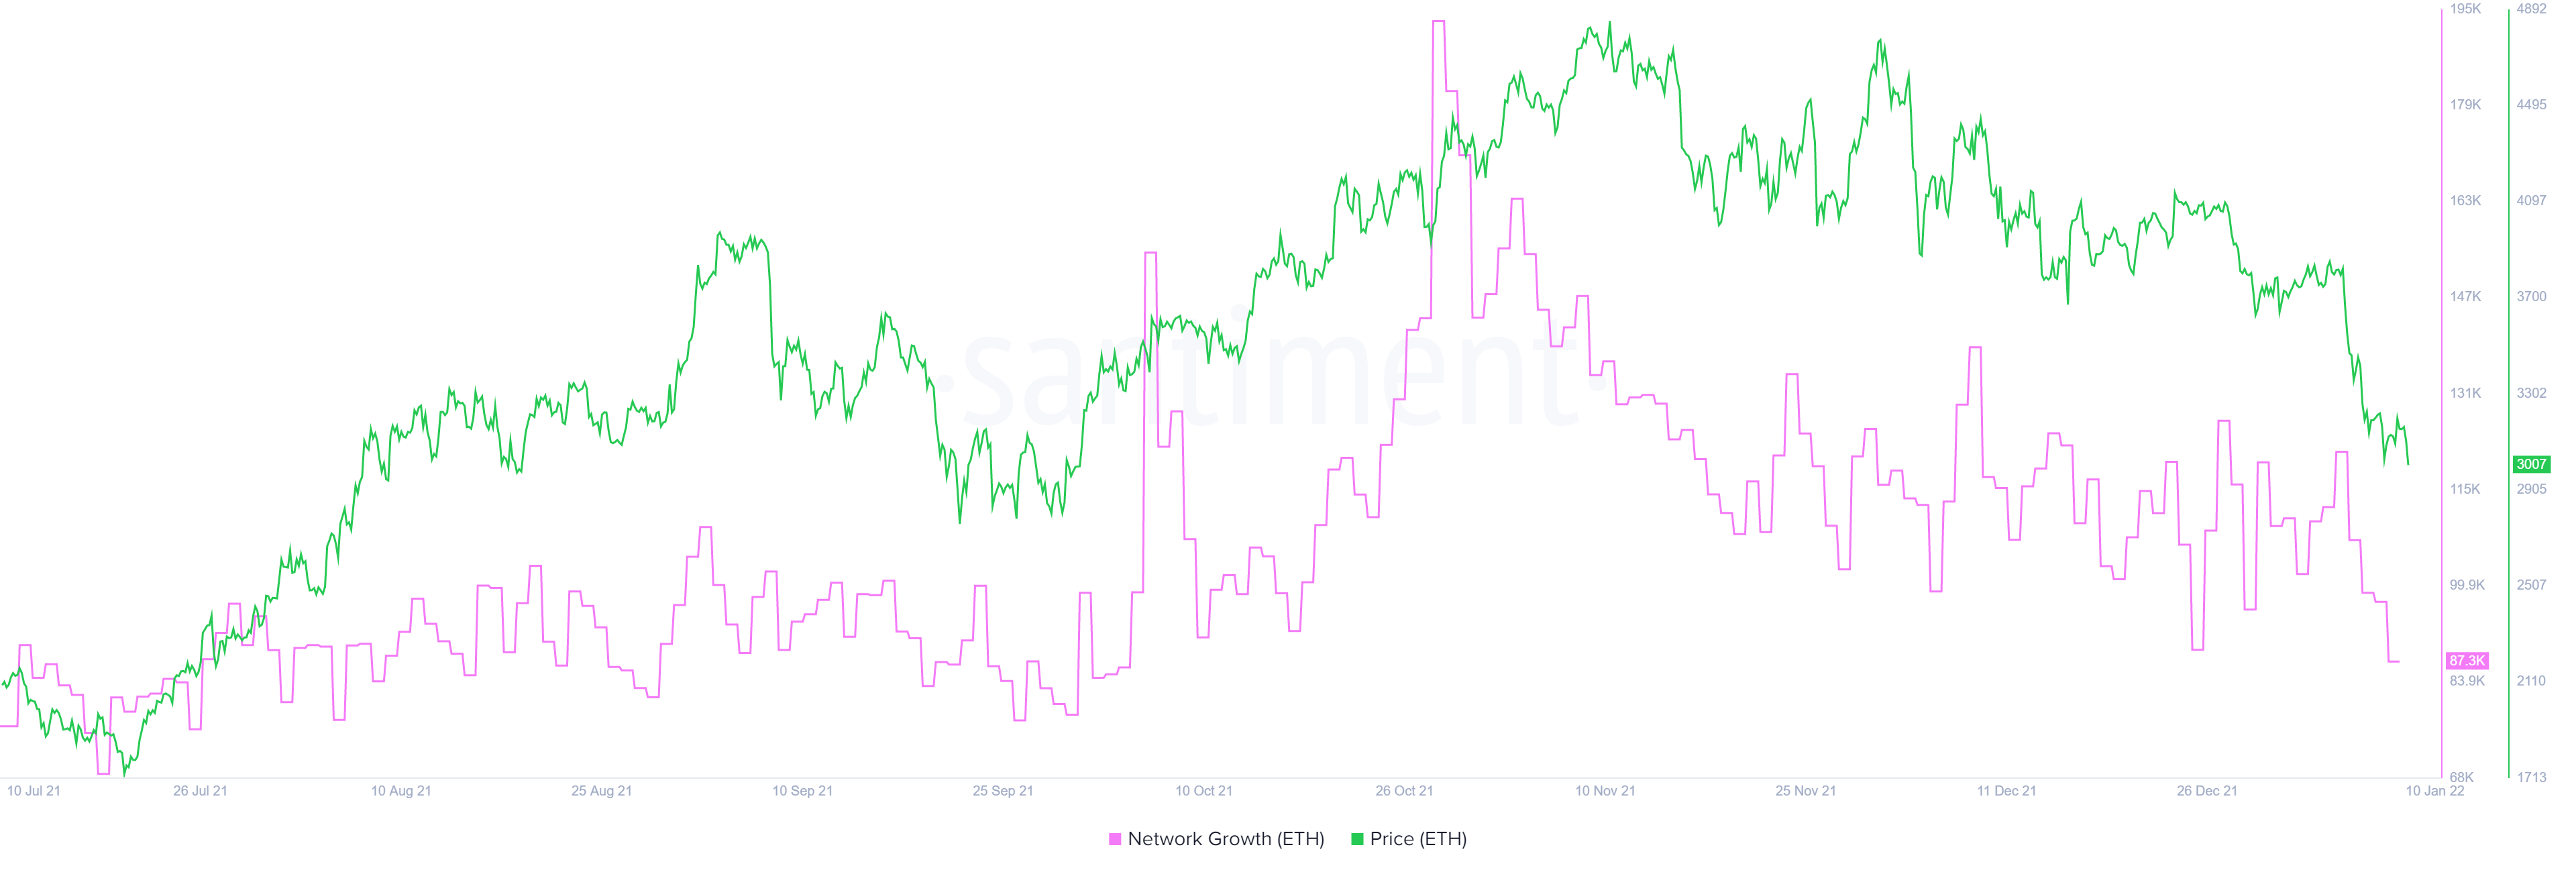
While the Ethereum price might seem poised to move higher, market participants should pay close attention to the Network Growth metric as this on-chain index is used to determine the interest and interaction of users with the project.
Currently, Network Growth is hovering at 87,300 after dropping from 193,640 on October 28, 2021. This 55% decline suggests that investors are not interested in ETH at the current levels.
ETH network growth
The estimated leverage ratio is also something that supports the short-term bullish outlook but warns investors to be cautious. This index is hovering around 0.158, an all-time high, indicating that many investors are taking on high risk, which could lead to a catastrophic flash crash if things take a turn.
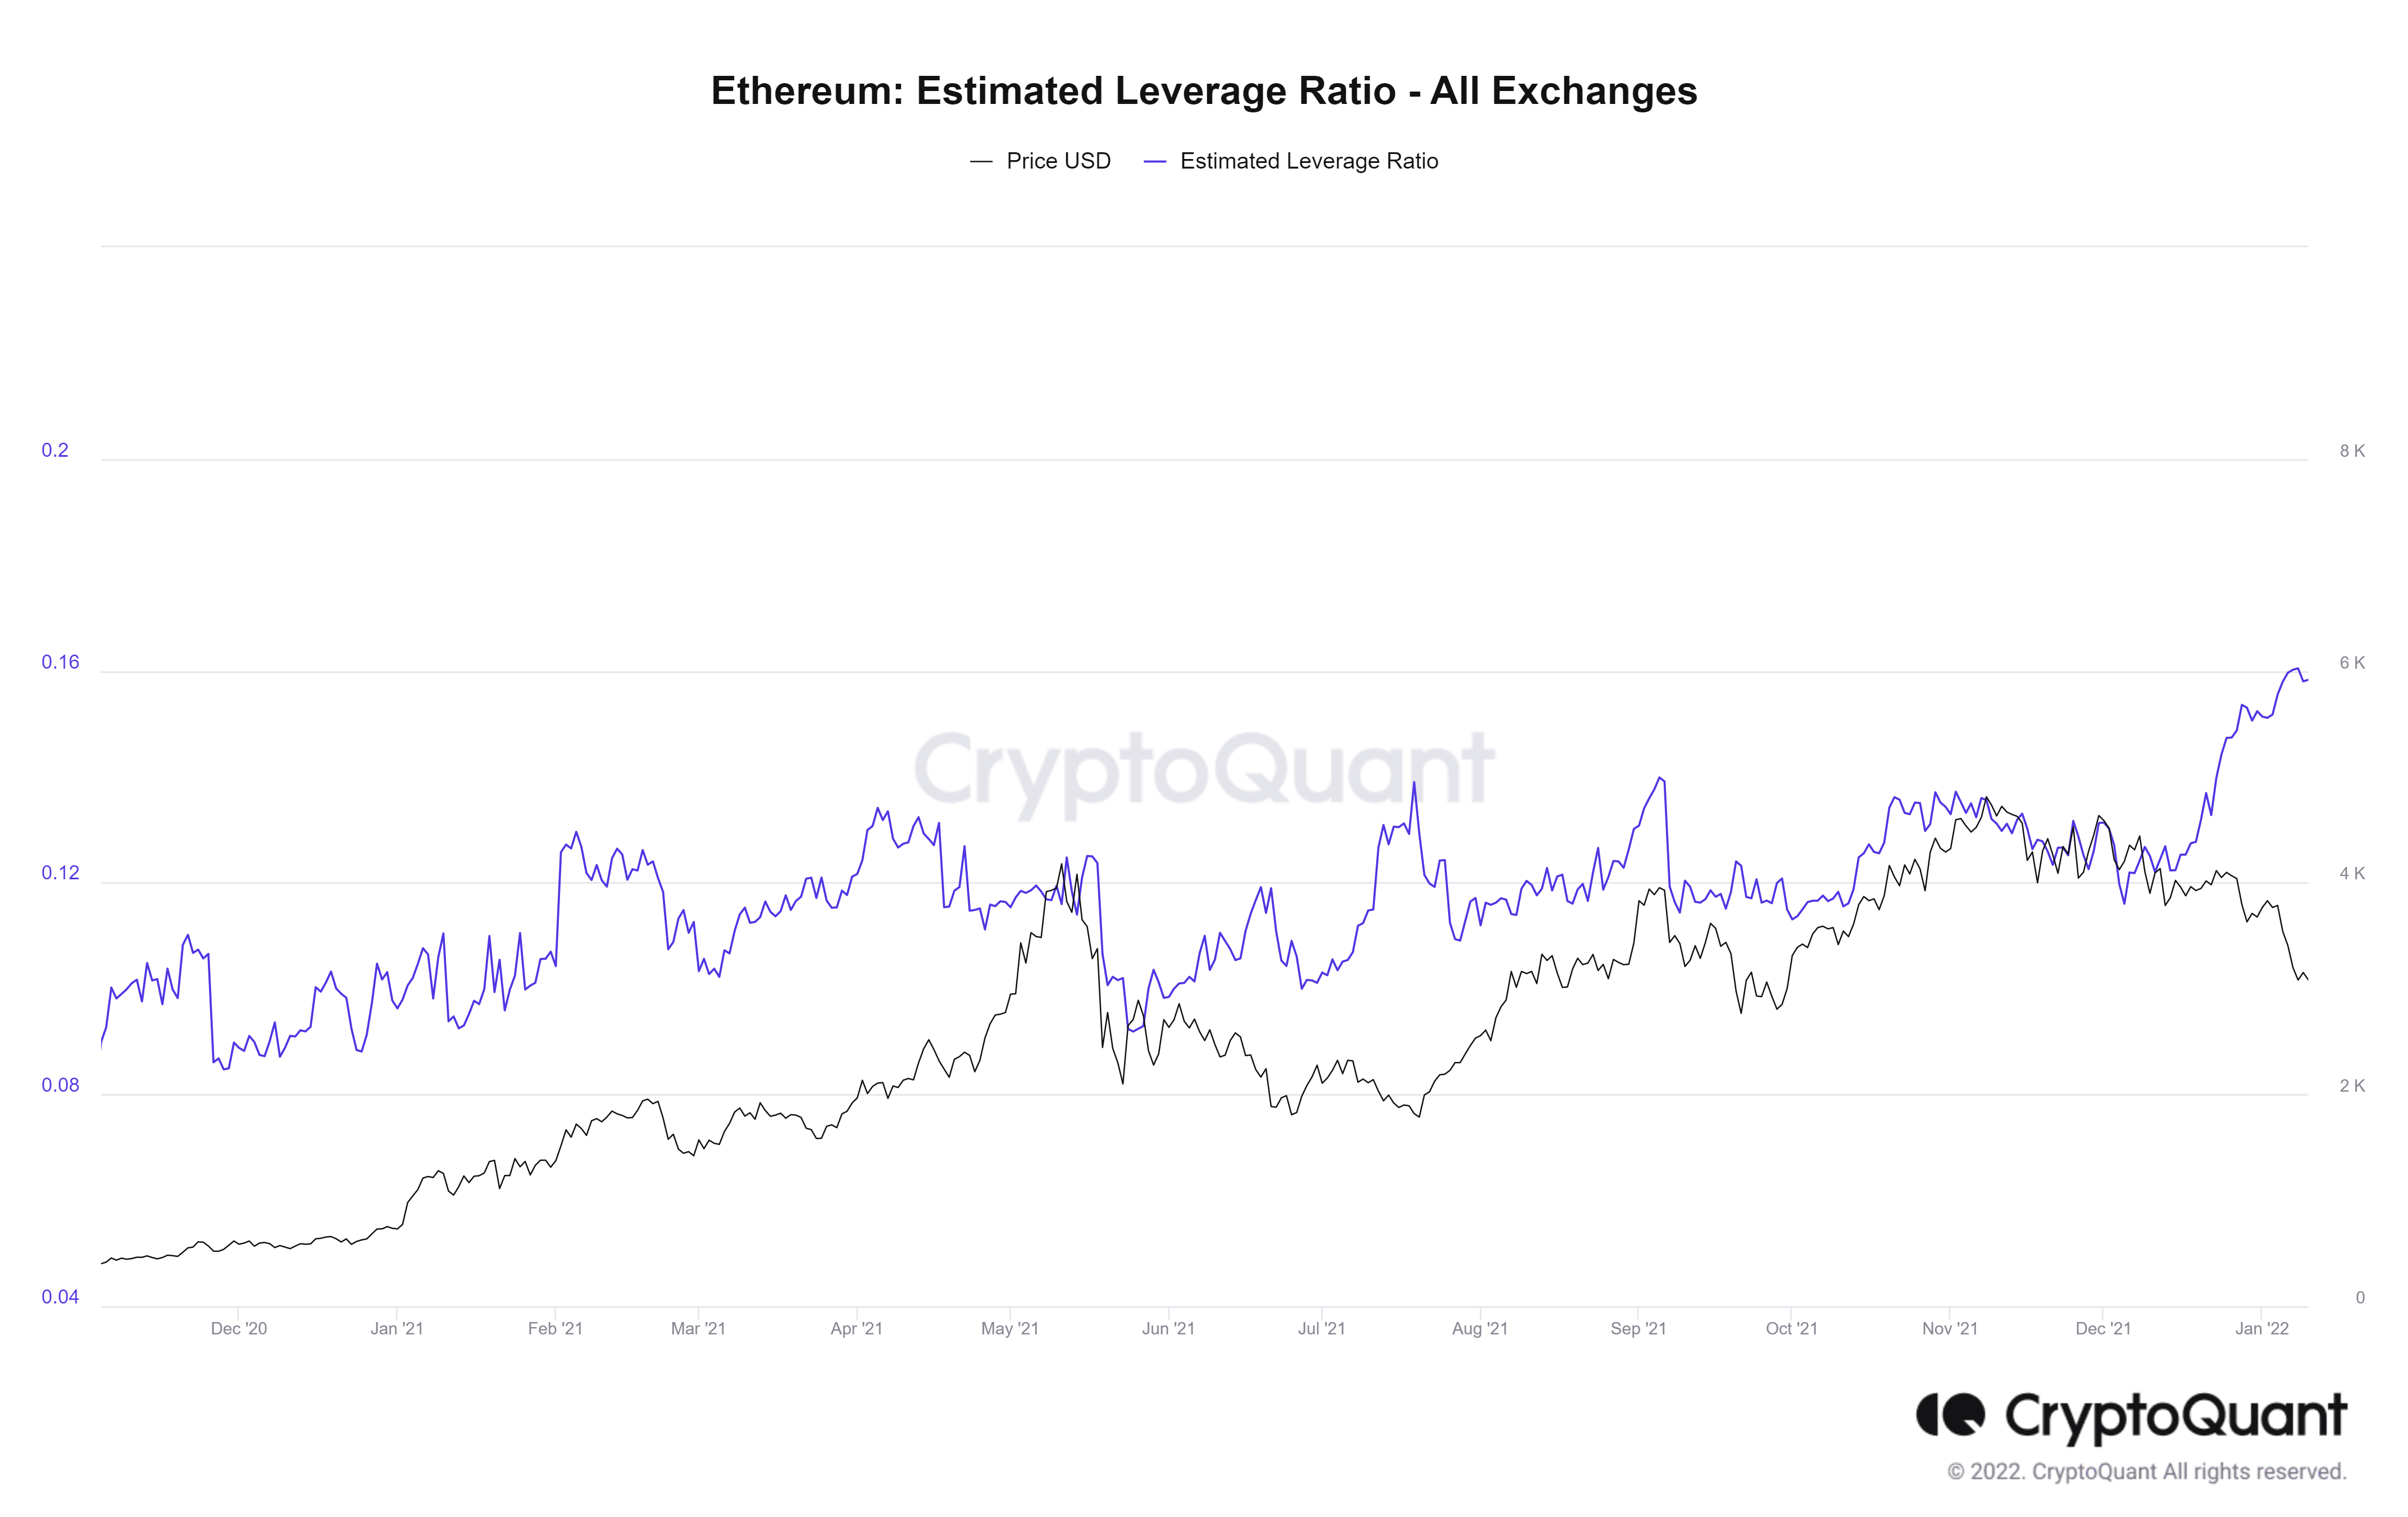
ETH estimated leverage ratio
If Ethereum price fails to bounce off the weekly support level at $3,061, there is a high chance it could fall through it and revisit the subsequent barrier at $2,712, to then collect the sell-stop liquidity resting below it. If ETH produces a daily close below $2,636, it will create a lower low, invalidating the bullish thesis entirely. This development could open the possibility of a further crash, allowing ETH to retest the $2,440 level.


