
- EUR/USD fades bounce off yearly low, remains sidelined inside bullish chart pattern.
- Steady RSI, lacklustre MACD hints at additional sideways moves.
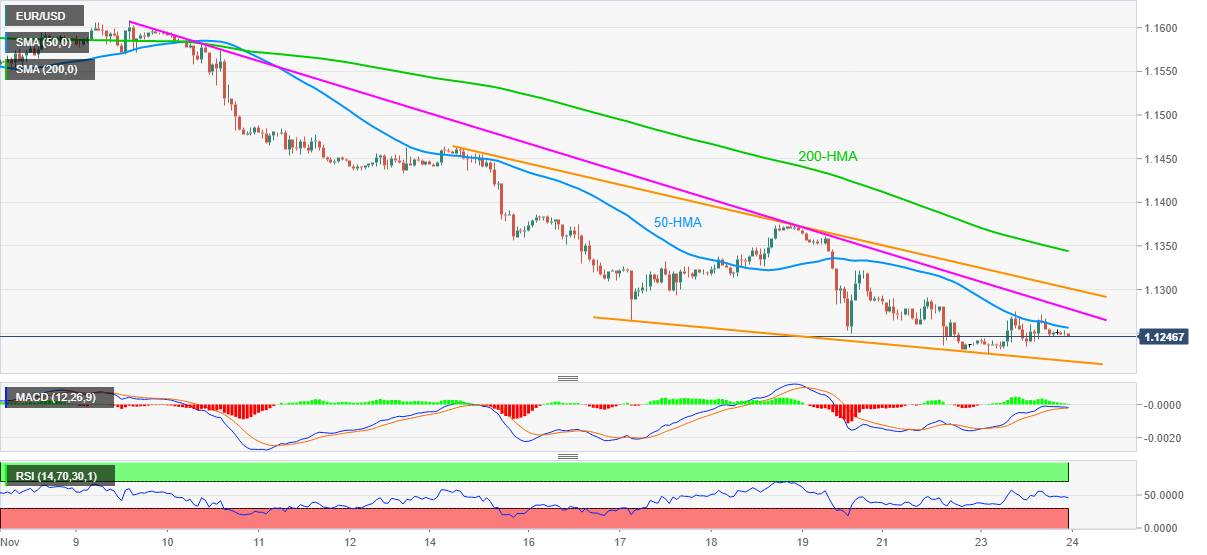
- 50-HMA, two-week-old resistance line restrict immediate upside moves.
- Sellers may eye late June 2020 lows on defying the wedge formation.
EUR/USD struggles to keep the rebound from the 16-month low around 1.1250 during the early Asian session on Wednesday.
The currency major pair refreshed the multi-day bottom the previous day before bouncing off 1.1226, which in turn portrayed a short-term falling wedge bullish chart pattern on the hourly play. However, steady RSI and sluggish MACD don’t favor the bulls, which in turn suggest further grinding towards the south.
That said, 50-HMA and a descending trend line from November 09, respectively around 1.1255 and 1.1280, limit the quote’s immediate recovery moves.
Following that, the stated wedge’s upper line around 1.1300 and 200-HMA level of 1.1345 will be important to invite EUR/USD bulls.
Alternatively, the support line of the wedge near 1.1215 and the 1.1200 threshold can lure the pair sellers ahead of June 2020 bottom near 1.1170.
Overall, EUR/USD bears remain in the driver’s seat until the quote crosses the 1.1345 hurdle.
EUR/USD: Hourly chart
Trend: Bearish


