
Bitcoin falls along with major stock indexes; spot trading volume is sluggish.
Good morning. Here’s what’s happening this morning:
Market moves: Bitcoin’s relief rally” appears to be temporary, after major central banks announced plans to battle high inflation
Technician’s take: Bitcoin could see a brief price bounce, although sellers remain in control.
Prices
Bitcoin (BTC): $47, 683 -2.3%
Ether (ETH): $3,981 -1.54%
Markets
S&P 500: $4,668 -0.8%
Dow Jones Industrial Average: $35,896 -0.08%
Nasdaq: $15,180 -2.4%
Gold: $1,798 +1%
Market moves
Bitcoin’s “relief rally” after the U.S. Federal Reserve officials approved the acceleration of its plan to withdraw the pandemic stimulus efforts appeared to be short-lived, as the oldest cryptocurrency dropped below $48,000 on Thursday.
The drop came after major U.S. stock indexes fell amid plans by Europe’s top central banks to battle high inflation. The S&P 500, Dow Jones Industrial Average and tech-heavy Nasdaq Composite declined, the Nasdaq by over 2%.
“Bitcoin and [Big Tech] are getting punished today as investors reallocate some of their more profitable risky bets,” Edward Moya, senior market analyst of the Americas at OANDA, wrote in his newsletter. “The crypto space is seeing a lot of repositioning and that is leading to some unwanted selling pressure, but the medium- and -long-term outlooks remain firmly in place.”
Bitcoin’s spot trading volume across major centralized exchanges was also low on Thursday.
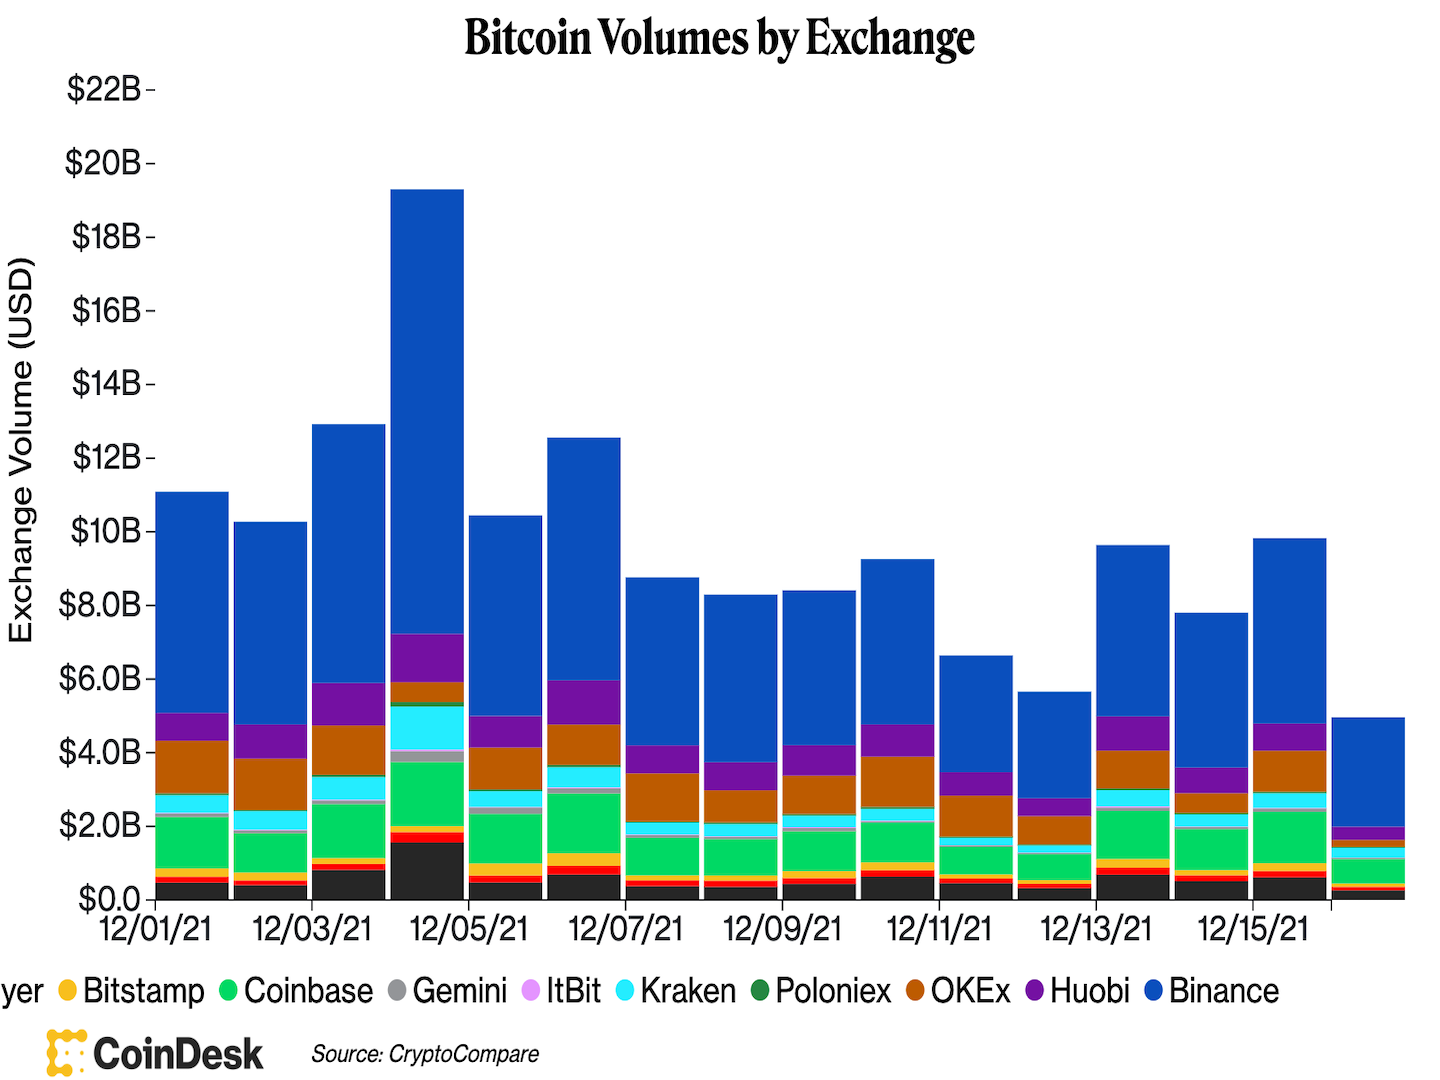
(CoinDesk/CryptoCompare)
Alternative cryptocurrencies also fell. Ether dropped below $4,000 again and yesterday’s biggest winners including solana and avalanche were in the red too, at the time of publication.
Technician’s take
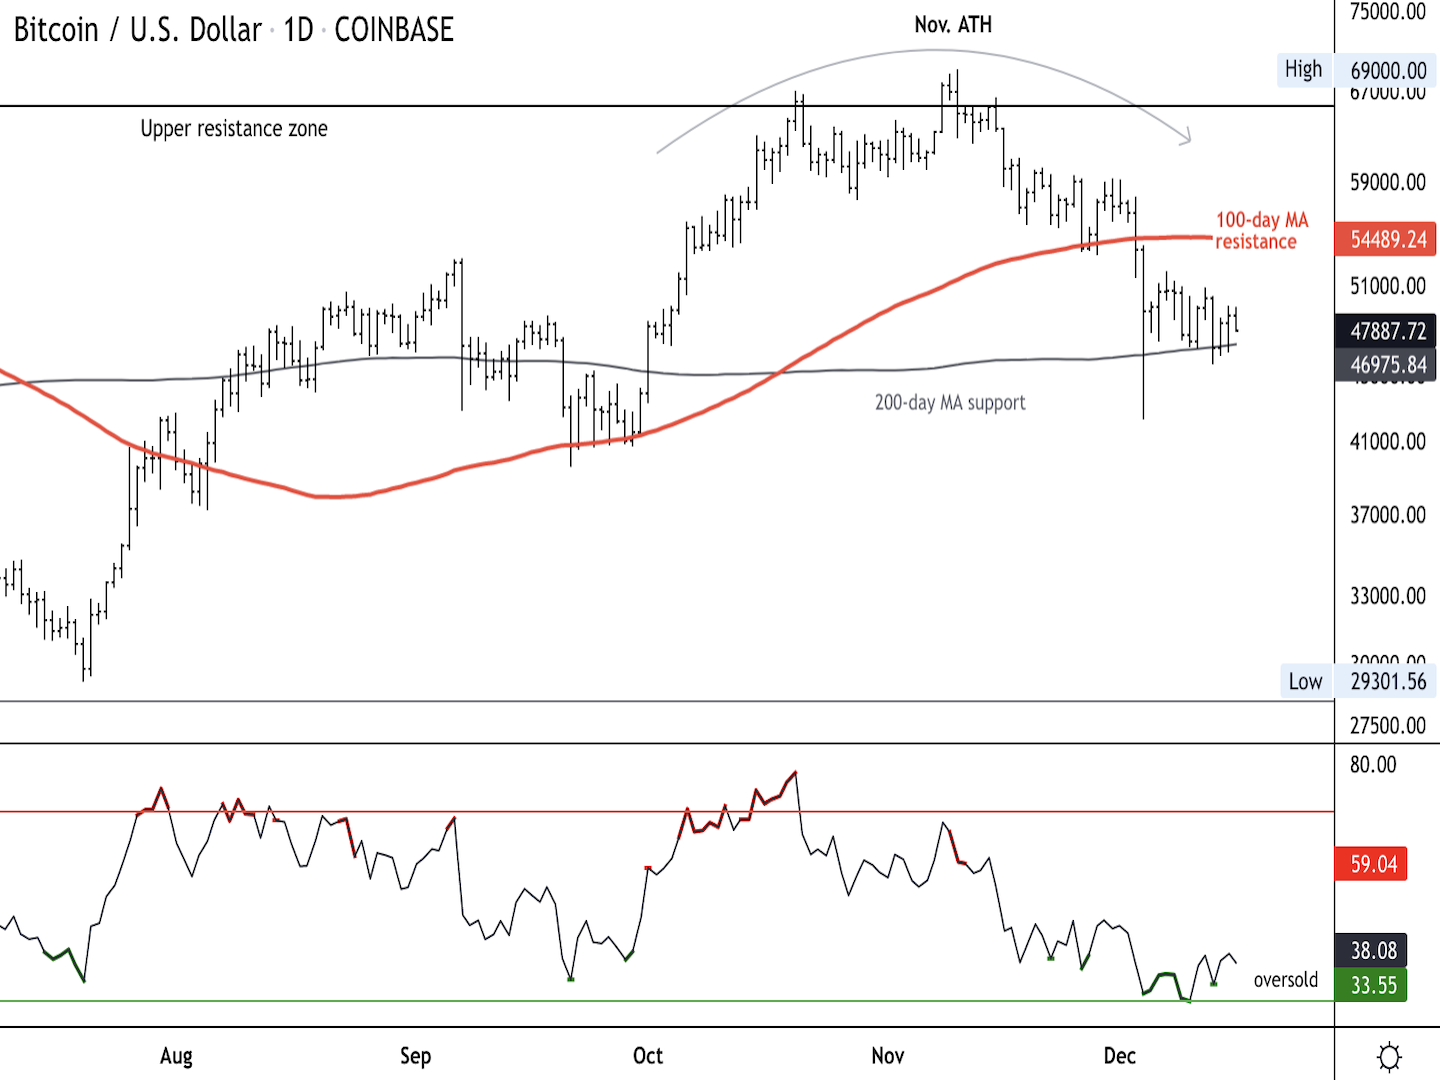
Bitcoin daily price chart (Damanick Dantes/CoinDesk, TradingView)
Bitcoin (BTC) continues to hold support above $46,000, which is near its 200-day moving average. The cryptocurrency could see a brief price bounce toward $55,000 if buyers react to oversold signals on the charts.
Price momentum is starting to turn positive on the daily chart for the first time since October, which preceded a price recovery. This time, however, the uptrend is slowing on the weekly chart, which means upside could be limited beyond $55,000 to $60,000.
The relative strength index (RSI) on the daily chart is the most oversold since late September, although buying has been weak relative to prior RSI signals.
Important events
12 a.m. HGT/SGT (8 a.m. UTC): New Zealand business confidence (Dec.)
12 p.m. HGT/SGT (3 a.m. UTC): Bank of Japan policy statement
3 p.m. HGT/SGT (7 a.m. UTC): U.K. retail sales except fuel (Nov. YoY/MoM)


