
- GBP/USD bulls take a breather after two-day uptrend, pokes eight-day-old descending trend line.
- Clear break of 50-SMA joins bullish MACD signals, firmer RSI to keep buyers hopeful.
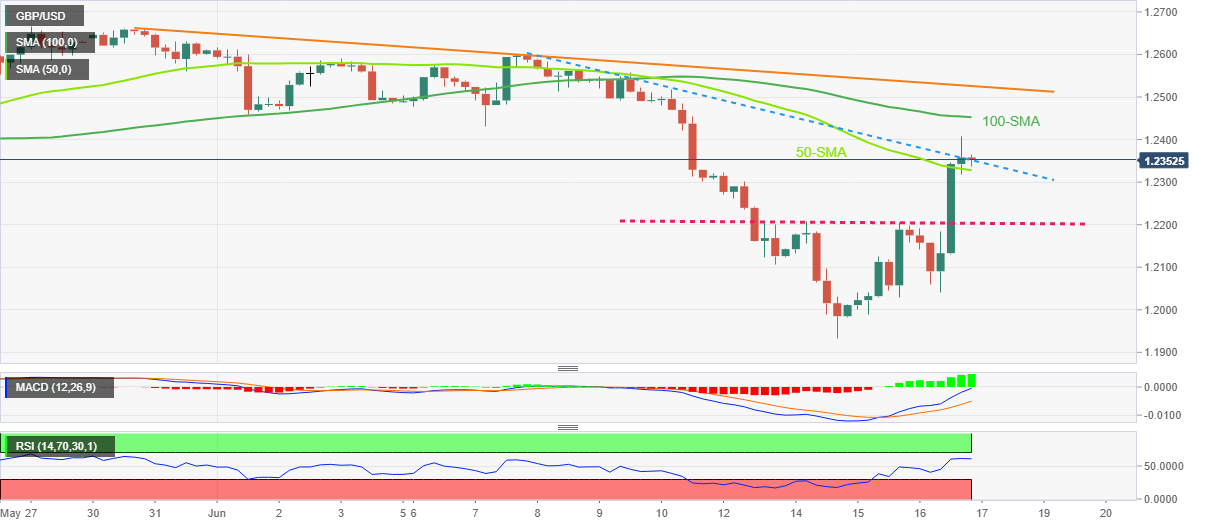
- 100-SMA, monthly resistance line lures bulls, sellers need validation from weekly support for fresh entry.
GBP/USD dribbles around 1.2350 amid Friday’s Asian session, after refreshing the weekly top during a two-day uptrend the previous day.
In doing so, the Cable pair jostles with an eight-day-old descending trend line resistance while keeping the latest upside break of the 50-SMA and the weekly horizontal resistance area, now support.
Other than the latest breakouts, the firmer RSI (14) conditions, not oversold, join the bullish MACD signals to keep GBP/USD buyers hopeful.
However, a clear upside break of the 1.2350 becomes necessary for the cable pair to aim for the immediate hurdles, namely the 100-SMA and a descending trend line from May 30, respectively around 1.2450 and 1.2530.
It’s worth noting that the clear upside break of 1.2530 won’t hesitate to propel the GBP/USD prices beyond the monthly high around 1.2600.
Alternatively, pullback moves remain elusive until the quote drops back below the 50-SMA level near 1.2325.
Also acting as short-term key support is the previous horizontal resistance area comprising multiple tops marked since Monday, near 1.2210-2200.
GBP/USD: Four-hour chart
Trend: Further upside expected


