- GBP/USD remains vulnerable despite oversold on the daily chart.
- Risk-aversion, Fed-BOE contrast and weak UK data keep the GBP undermined.
- Descending triangle breakdown opens floor towards 0.2650 pattern target.
GBP/USD is on a downward spiral towards 1.2700, as bears remain unrelenting following Friday’s 200-pips sell-off from 1.3035 levels.
Aggressive Fed’s tightening expectations, China's covid lockdowns and a likely EU embargo on the Russian oil imports dent the investors’ sentiment on Monday, as the safe-haven US dollar catches up on its extended rally. The dollar’s strength combined with risk-aversion adds to the weight on the high-beta pound.
Meanwhile, the Fed-BOE monetary policy divergence got widened further after the UK Retail Sales and S&P Global Preliminary Services PMI disappointed in the reported month. The central banks’ contrast will continue to remain a headwind for cable.
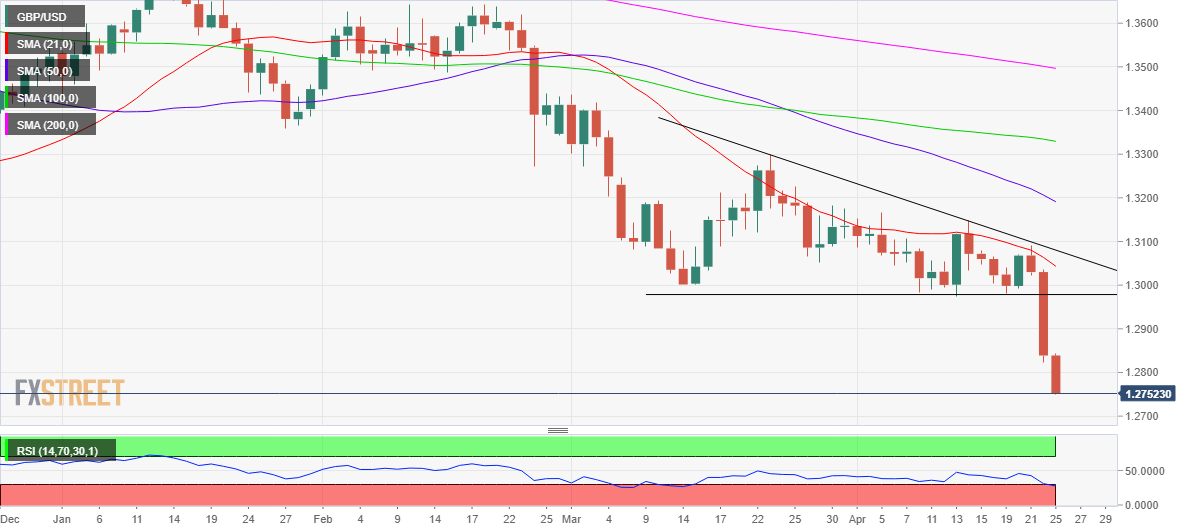
Looking at the daily chart, GBP/USD’s sell-off yielded a downside break from a descending triangle formation after the price closed below the 1.2975 triangle support on Friday.
In light of the triangle breakdown, cable remains on track to test the pattern target measured at 1.2650, as the 1.2700 level appears at risk, as of writing.
The 14-day Relative Strength Index (RSI) has entered into the oversold region, suggesting that a pullback cannot be ruled out in the near term.
Although the way the sellers remain in full form, bearish exhaustion appears elusive. Should the pair attempt a rebound, recapturing the 1.2800 barrier will be critical.
Further up, the daily highs of 1.2842 could be put to test.
GBP/USD: Daily chart