
- A combination of factors dragged Gold below the $1,800, back closer to the YTD low on Friday.
- Aggressive Fed rate hike bets, broad-based USD strength exerted heavy downward pressure.
- Recession fears did little to impress bulls or lend any support to the safe-haven commodity.
The prospects for a more aggressive policy tightening by major central banks to curb soaring inflation continued taking its toll on the non-yielding gold. Apart from this, the underlying bullish tone around the US dollar was seen as another factor that weighed heavily on the dollar-denominated commodity. Spot prices broke through the $1,800 psychological mark and tumbled back closer to the YTD low during the early North American session. Meanwhile, growing worries about a possible global recession did little to impress bullish traders or lend any support to the safe-haven XAUUSD. This, in turn, suggest that the path of least resistance for the precious metal is to the downside.
Gold Price: Key levels to watch
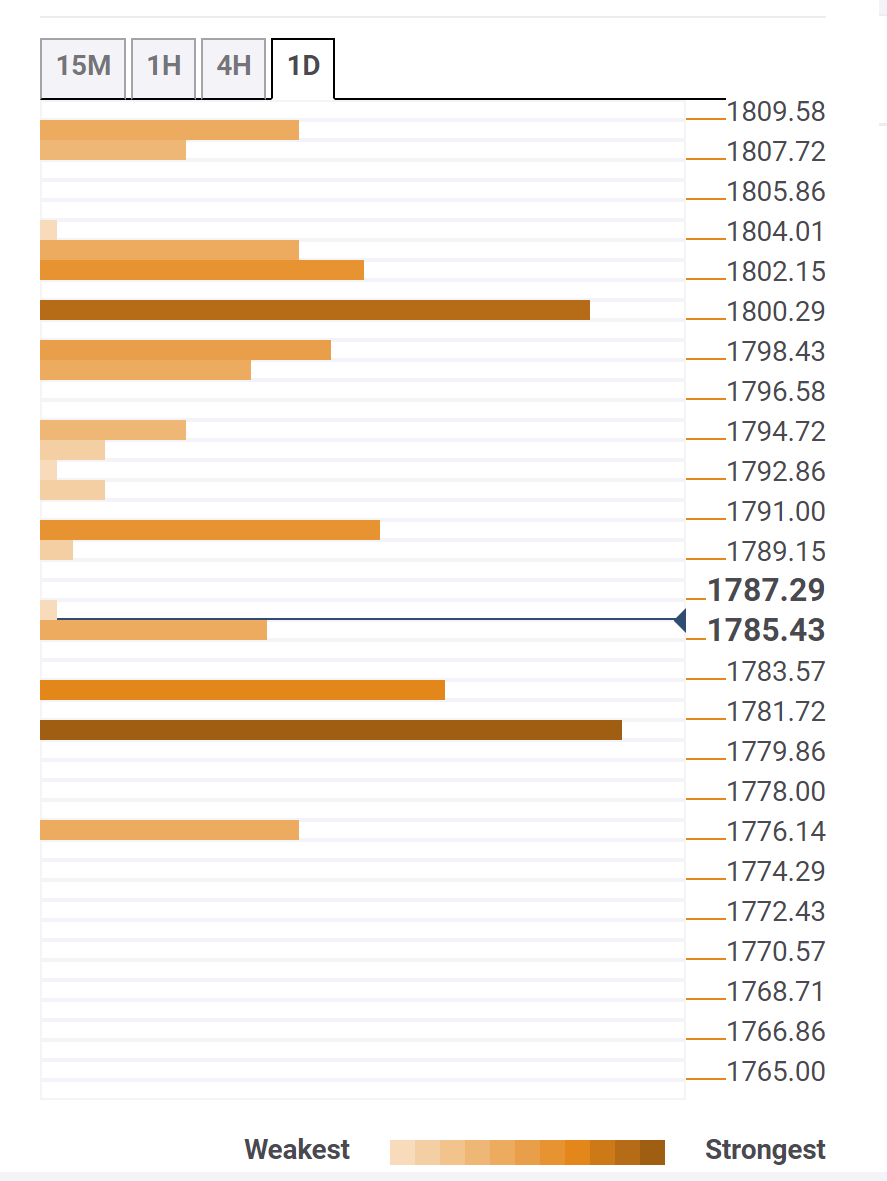
The Technical Confluence Detector shows that Gold Price could find decent support near the YTD low, around the $1,780 region. The said area coincides with Pivot Point one month S1 and is closely followed by Pivot Point one day S3. A convincing break below the latter would be seen as a fresh trigger for bearish traders and pave the way for an extension of the ongoing downward trajectory.
On the flip side, the $1,790 region – the convergence of Pivot Point one day S2 and Bollinger Band one-hour Lower and SMA – now seems to act as immediate resistance. Sustained strength beyond might trigger a short-covering bounce and lift Gold Price back towards the $1,798-$1,800 area. The said hurdle comprises Pivot Point one week S2, Pivot Point one day S1 and 5-period SMA 4-hour.
About Technical Confluences Detector
The TCD (Technical Confluences Detector) is a tool to locate and point out those price levels where there is a congestion of indicators, moving averages, Fibonacci levels, Pivot Points, etc. If you are a short-term trader, you will find entry points for counter-trend strategies and hunt a few points at a time. If you are a medium-to-long-term trader, this tool will allow you to know in advance the price levels where a medium-to-long-term trend may stop and rest, where to unwind positions, or where to increase your position size.


