
Most of the coins have come back to the previous levels as they are located in the green zone.
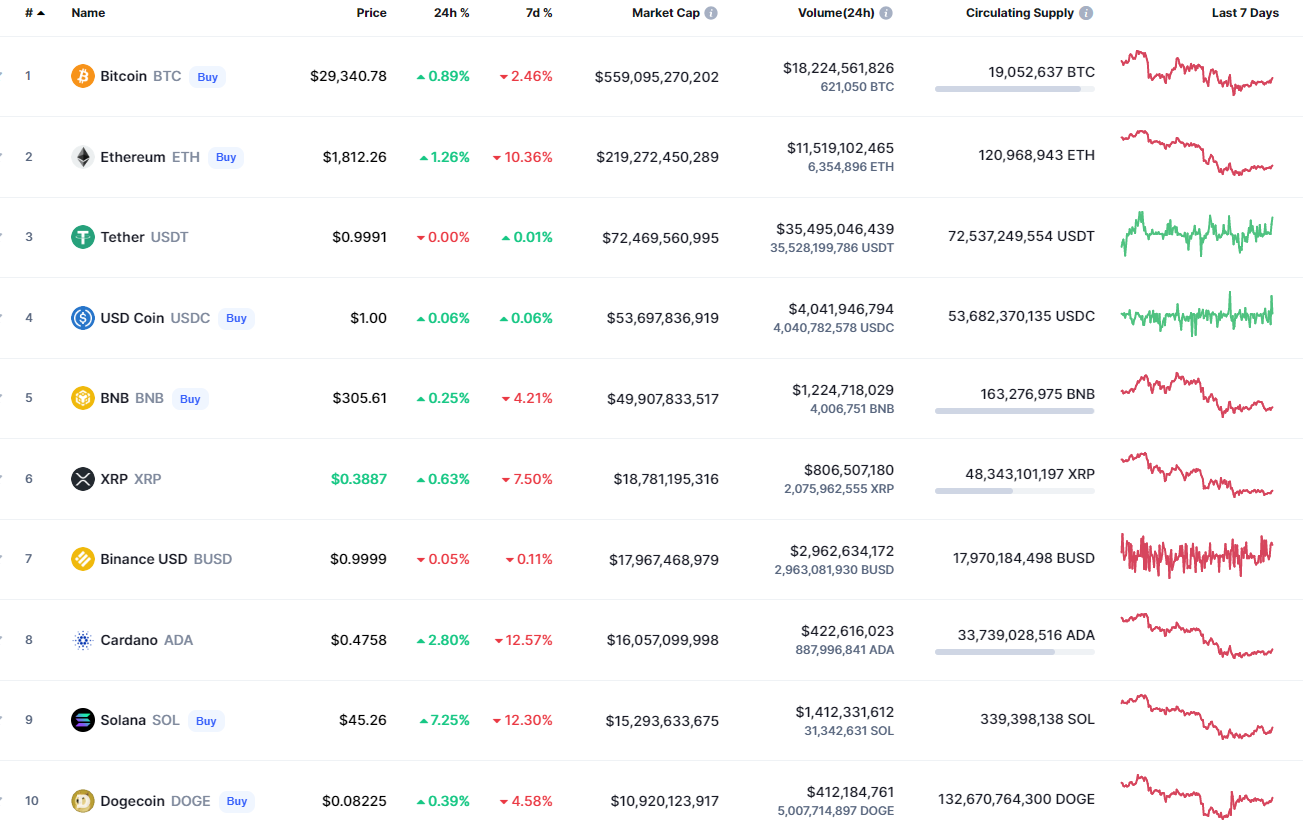
Top coins by CoinMarketCap
BTC/USD
Despite today's slight rise, the rate of Bitcoin (BTC) has gone down by 2.24% over the last seven days.
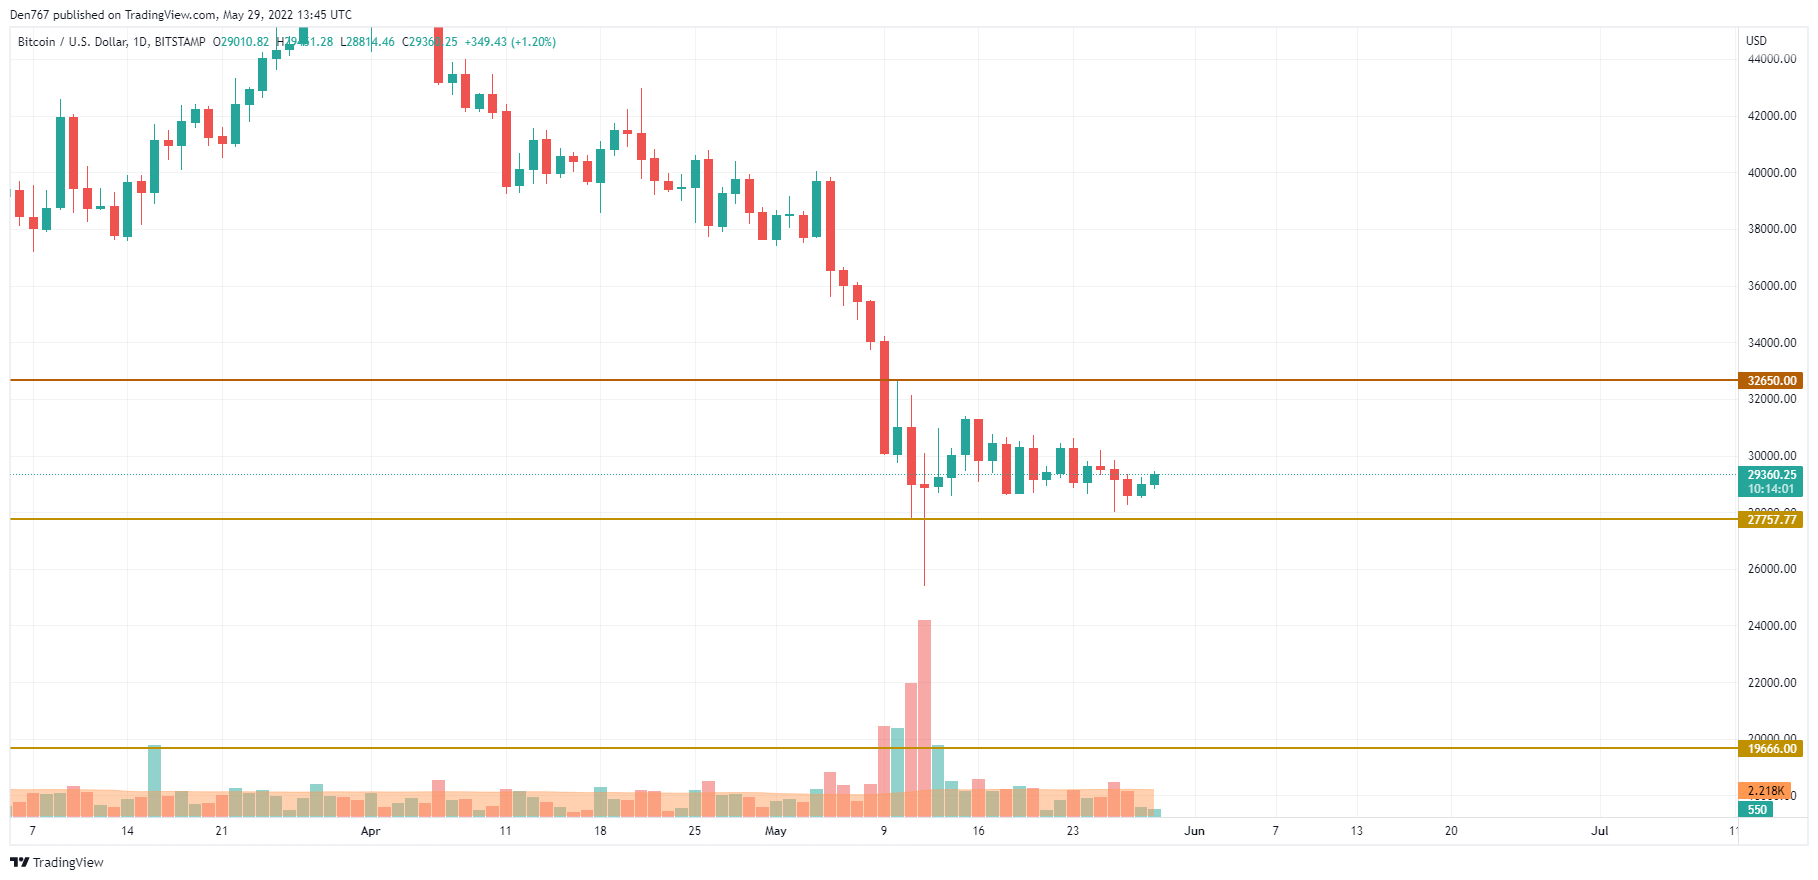
BTC/USD chart by TradingView
Bitcoin (BTC) remains trading above $29,000, which means that the growth may continue next week if they can hold the initiative. In this case, one should pay attention to the $30,000 mark, the test of which may be a prerequisite for the local trend change.
In this case, the upward move can lead to the growth of the resistance around $33,000.
Bitcoin is trading at $29,329 at press time.
ETH/USD
Ethereum (ETH) has lost more than Bitcoin (BTC) in terms of the weekly price change with a decline of 10%.
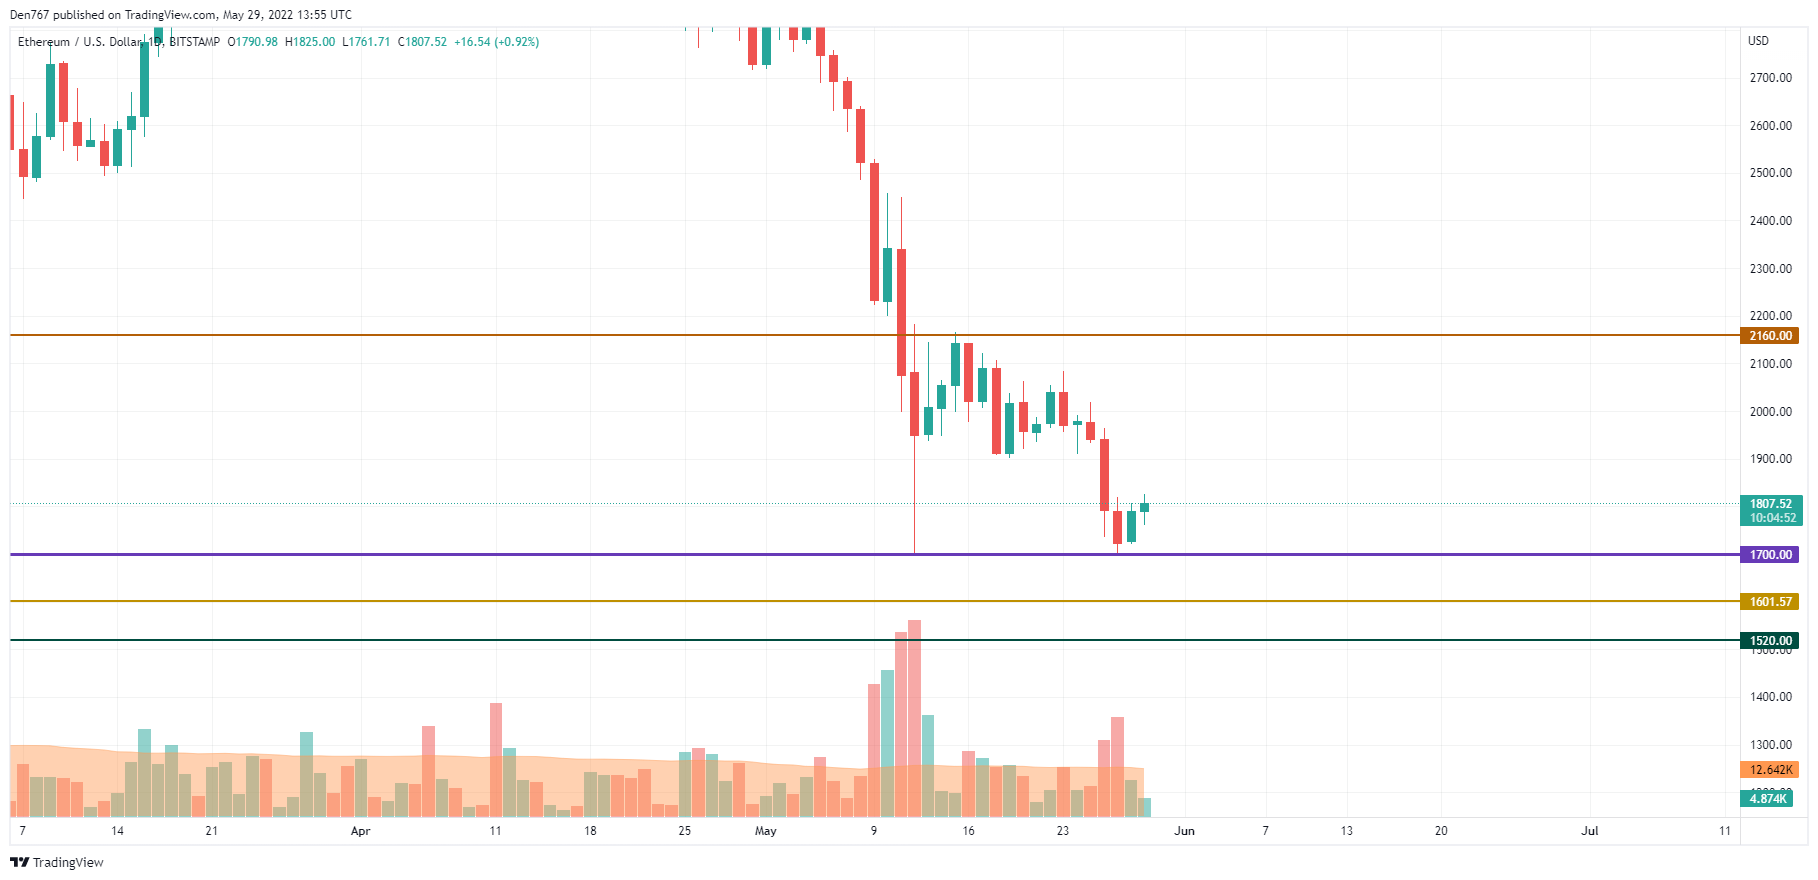
ETH/USD chart by TradingView
Ethereum (ETH) has come back above the $1,800 mark, which is also locally bullish for the main altcoin. If the buying trading volume increases, there are chances to expect the test of the $1,900 zone next week.
Ethereum is trading at $1,808 at press time.
BNB/USD
The rate of Binance Coin (BNB) has also gone down over the last seven days.
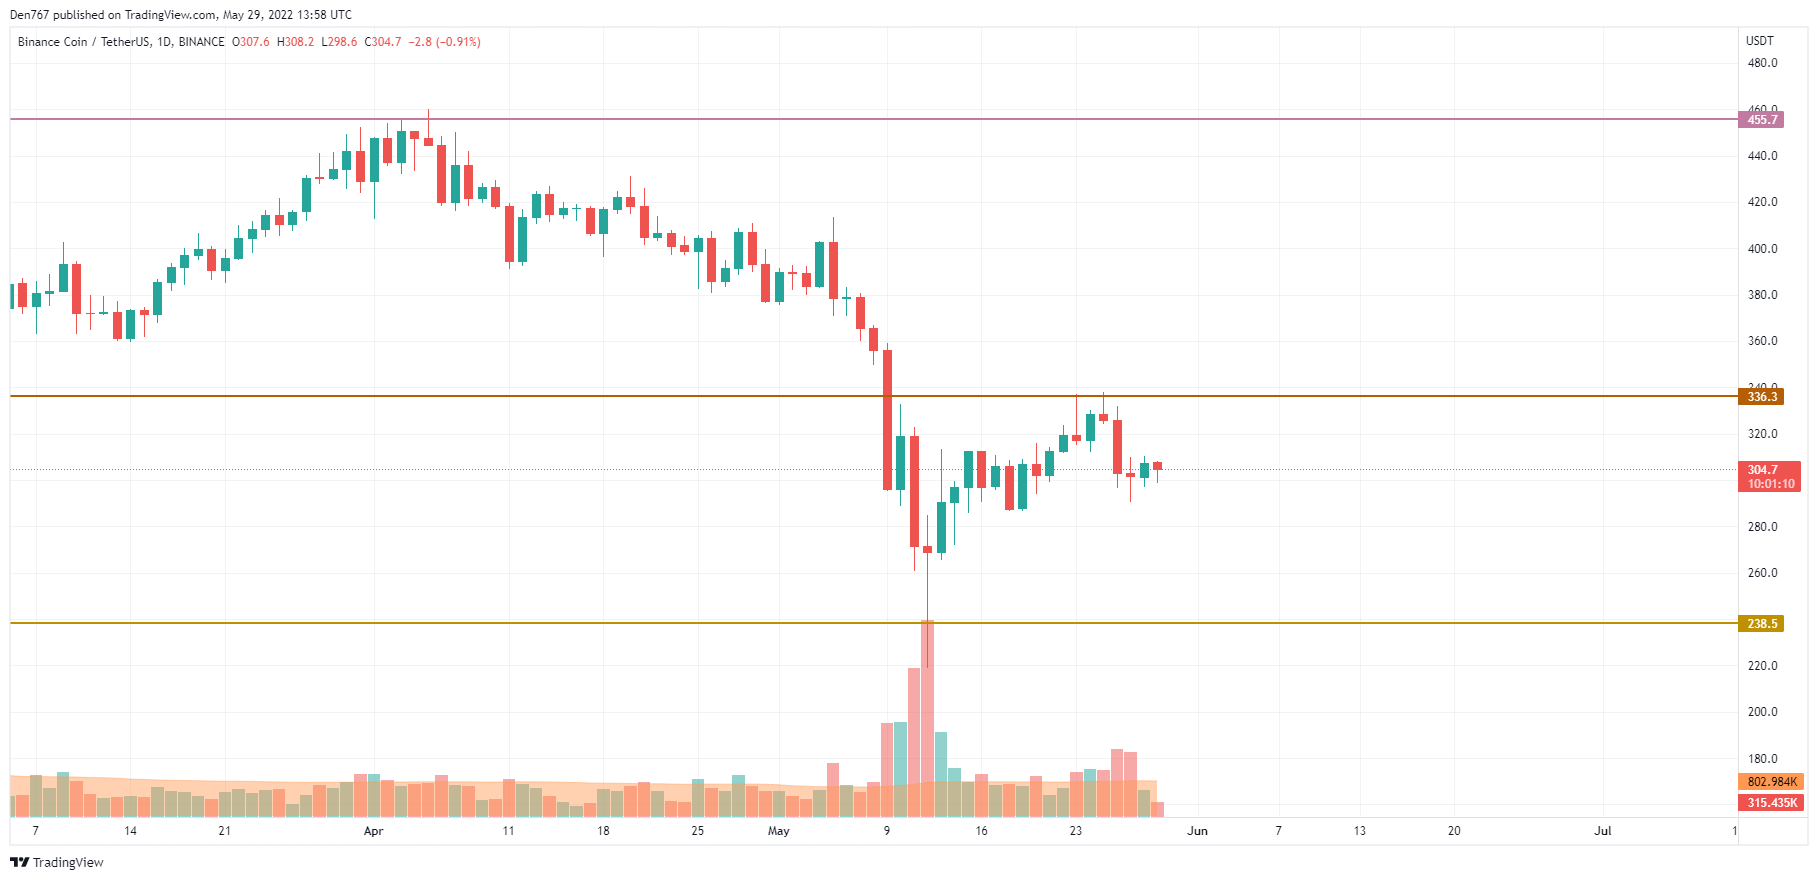
BNB/USD chart by TradingView
On the daily time frame, the native exchange coin has returned above the important $300 mark. Thus, the rate is not far away from the resistance, which means that there is a possibility to see a rise to the $336 level soon.
BNB is trading at $304.8 at press time.
ADA/USD
Cardano (ADA) is the biggest loser from the list in terms of weekly change with a drop of 12%.
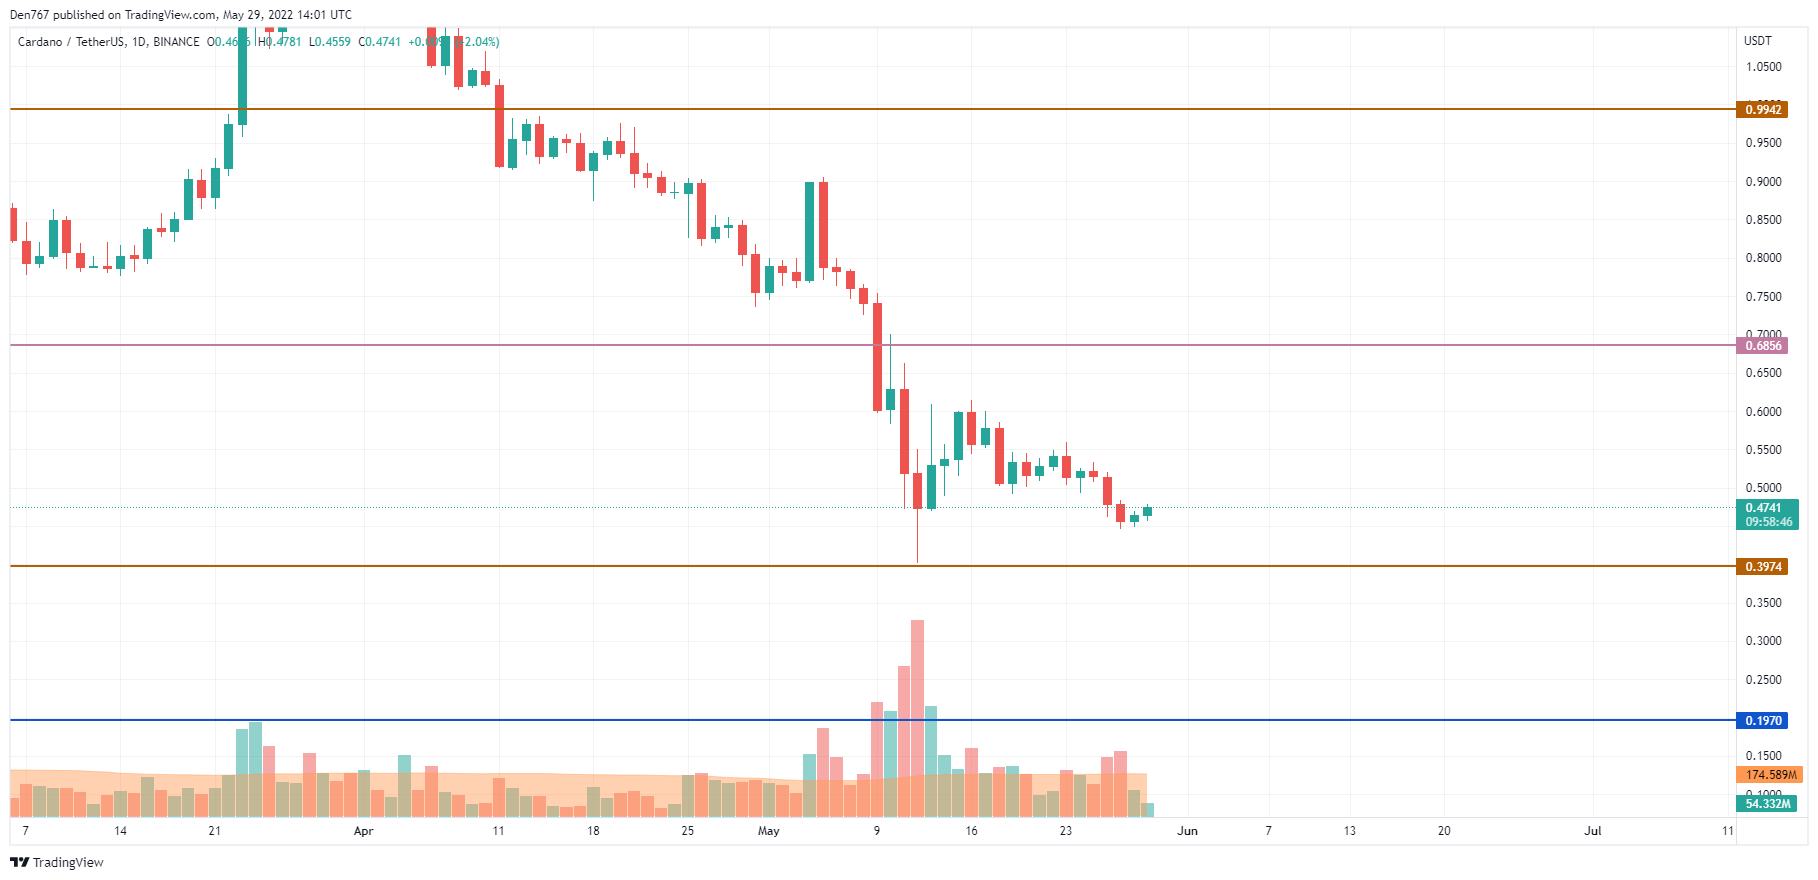
ADA/USD chart by Trading View
Unlike other coins, Cardano (ADA) remains bearish as the bulls could not return the rate to the $0.50 mark. Respectively, until the price is below it, there are more chances to see a further decrease to the support at $0.3974 than a bounceback.
ADA is trading at $0.4740 at press time.
TRX/USD
TRX is the only coin located in the green zone as the growth has constituted 7% over the previous week.
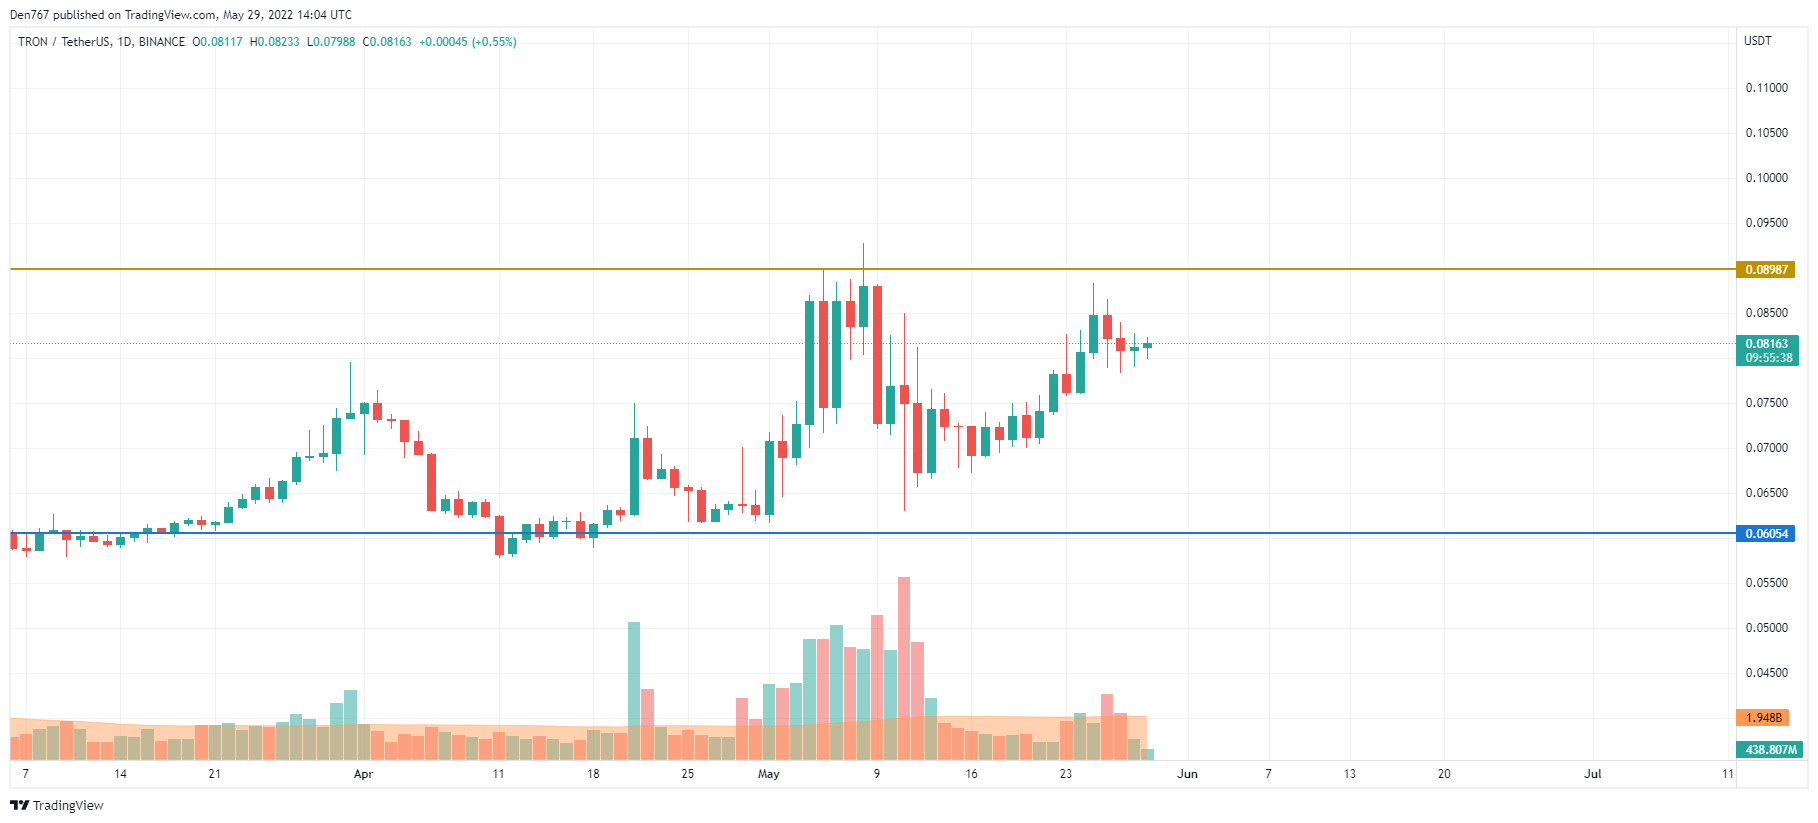
TRX/USD chart by TradingView
Despite the rise, TRX has not accumulated enough power for a continued rise based on the low volume. However, if the upward move continues to the $0.085 mark, there is chance to see the retest of the $0.08987 resistance shortly.
TRX is trading at $0.08155 at press time.


