
- Litecoin bulls look to fight back control, with eyes on the six-month top.
- LTC price spots a bull flag on the 12H chart, awaits confirmation.
- RSI stalls its descent while above 50.00, underpinning the buying mood.
The corrective decline in Litecoin price appears to have lost steam from six-month highs of $298, as LTC bulls look to regain control this Saturday.
LTC price is attempting a tepid bounce from three-day lows of $244 reached Friday, currently trading at $251, almost unchanged on the day.
Despite the recent pullback from the multi-month top, the underlying bullish tone in Litecoin remains untouched amid encouraging fundamentals.
“Based on data from crypto intelligence platform IntoTheBlock, 88% of the wallet addresses holding Litecoin are currently profitable,” FXStreet’s Crypto Editor Ekta Mourya noted.
Adding credence to the bullish potential, a renowned forex trader and analyst Peter Brandt said that he expects LTC price to retest 2021 high at 395.
LTC price eyes further upside amid a potential bull flag
This week’s consolidative mode that followed Litecoin’s uptrend from November 6 lows of $191 to half-year highs has carved out a bull flag formation on the 12-hour chart.
LTC bulls need a sustained break above the falling trendline resistance at $264 to validate the bullish continuation.
A fresh upswing will then kick in towards the multi-month highs, which remain in close proximity to the $300 mark.
On buying resurgence, LTC price could look to challenge the $350 psychological level. Further up, the pattern target measured at $371 will be on LTC buyers’ radars.
A test of the $400 round number will be inevitable should LTC bulls find a strong foothold above the latter.
The Relative Strength Index (RSI) has stalled its downside momentum, now attempting a bounce while above the midline. The leading indicator backs the premise for a likely move higher. 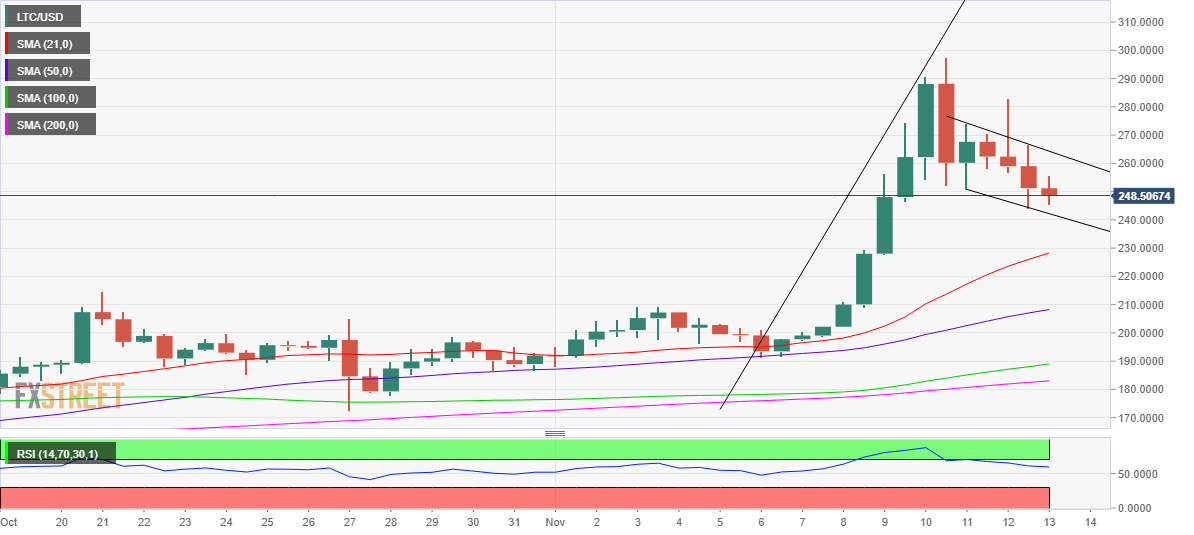
LTC/USD: 12-hour chart
On the flip side, if the selling momentum resumes, then the falling trendline support at $242 could be put at risk.
A 12-hourly candlestick closing below it would wipe out the expectations for a bull flag, opening up the additional downside towards the bullish 21-Simple Moving Average (SMA) at $228.
The next critical cushion is aligned at $208, which is the upward-sloping 50-SMA.


