
- NZD/USD snaps two-day rebound from yearly low, holds lower ground near intraday bottom of late.
- Sustained trading below 10-DMA, downbeat RSI keeps sellers hopeful.
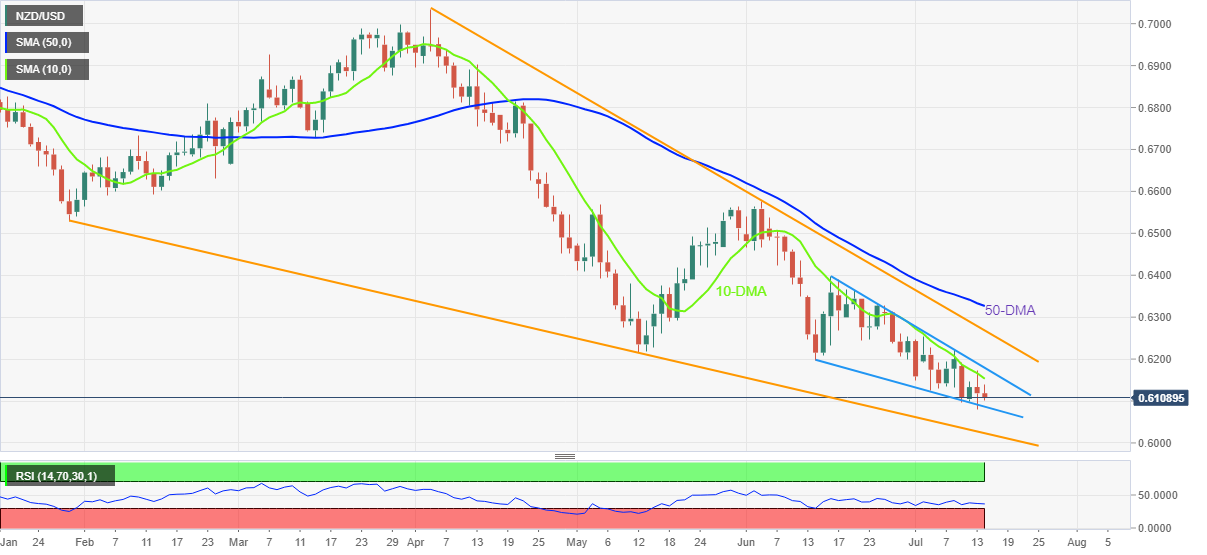
- Recovery remains elusive until the quote stays below 50-DMA.
NZD/USD remains pressured during the first loss-making day in three as sellers flirt with the 0.6100 threshold amid Thursday’s mid-Asian session. In doing so, the Kiwi pair remains inside a one-month-old falling wedge bullish chart pattern.
Given the quote’s repeated failures to cross the 50-DMA, NZD/USD is likely to remain pressured. The bearish bias also takes clues from the downbeat but not oversold RSI (14).
That said, the Kiwi pair presently drops towards the support line of the stated wedge, around 0.6085.
It should be noted that the RSI (14) is near the oversold territory and may test the extreme region suggesting a bounce in the NZD/USD prices if the pair remains weak below 0.6085.
In a case where the pair fails to rebound from 0.6085, by ignoring the RSI, the bears may not hesitate to refresh the multi-month low of 0.6080 while targeting a downward sloping support line from 0.6025.
Alternatively, a clear upside break of the 10-DMA level of 0.6153 will need validation from the aforementioned wedge’s resistance line, at 0.6180 now, to convince the NZD/USD bulls.
Following that, a run-up towards a three-month-old resistance line, near 0.6270, can’t be ruled out. However, the NZD/USD buyers remain cautious until witnessing a successful break of the 50-DMA level surrounding 0.6325.
NZD/USD: Daily chart
Trend: Limited downside expected


