
- NZD/USD bounces off intraday low, snaps two-day rebound from monthly low.
- Multiple technical support indicators test bearish candlestick formation.
- Steady RSI, sustained trading beyond 200-SMA keeps buyers hopeful.
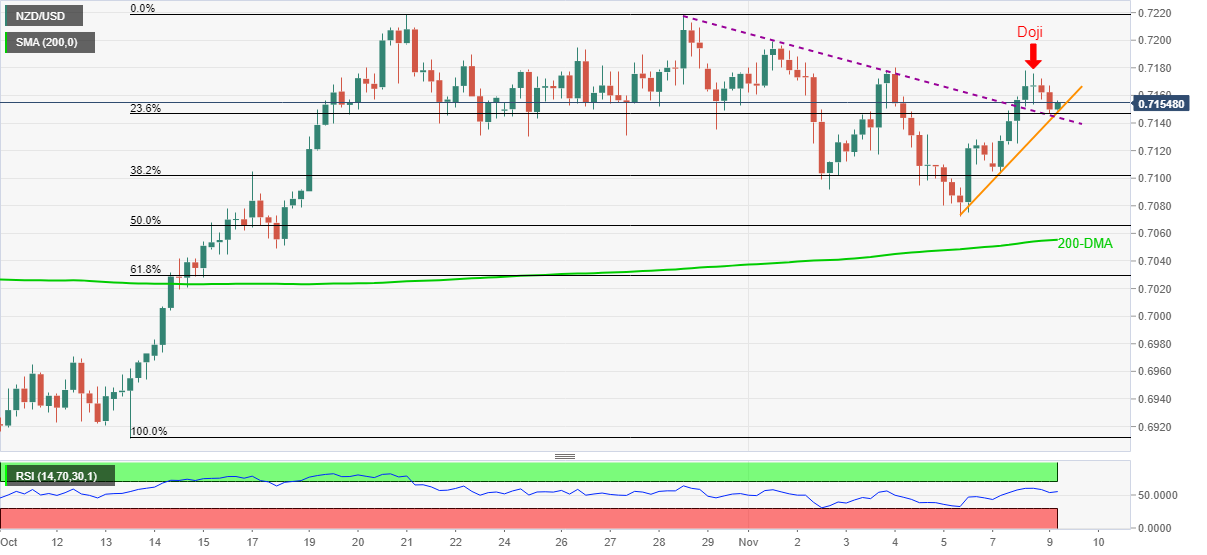
NZD/USD consolidates intraday losses around 0.7150, down 0.20% on a day heading into Tuesday’s European session.
In doing so, the Kiwi pair justifies the previous day’s Doji candlestick formation while battling a convergence of the weekly support line, previous resistance line from October 28 and 23.6% Fibonacci retracement (Fibo.) of October 13-21 upside.
Given the steady RSI and the bearish candle on the four-hour (4H) chart, the NZD/USD prices may witness further downside, below the immediate support near 0.7150-45.
During the fall, the latest swing low and 50% Fibo., respectively near 0.7070 and 0.7065, may offer intermediate halts before directing the quote towards the 200-SMA level of 0.7055.
Meanwhile, recovery moves remain less important until staying below the monthly peak of 0.7199.
Following that, the double tops marked during late October around 0.7220 become the key for the NZD/USD bulls.
NZD/USD: Four-hour chart
Trend: Further weakness expected


