
- NZD/USD eases after refreshing four-month high, probes two-day uptrend.
- 61.8% Fibonacci retracement of February-August fall challenge bulls.
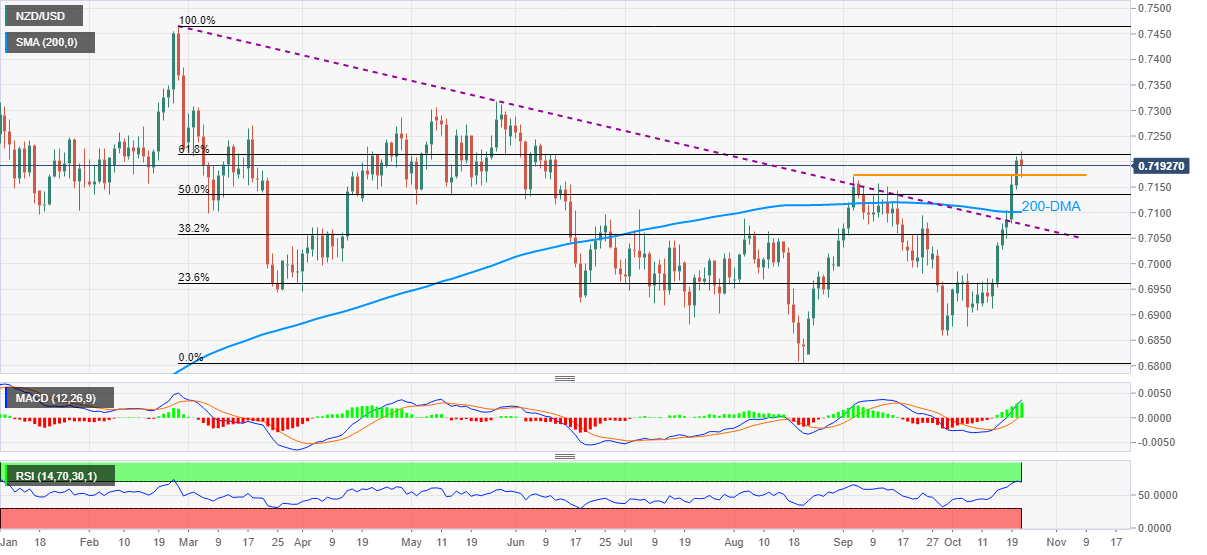
- September’s top restricts immediate downside ahead of 200-DMA.
- Overbought RSI also plays role in latest pullback.
NZD/USD drops back to 0.7200, taking a U-turn from a fresh multi-day high heading into Thursday’s European session.
In doing so, the Kiwi pair justifies overbought RSI conditions while stepping back from the 61.8% Fibonacci retracement level (Fibo.) of the quote’s downtrend from February to August 2021.
However, sellers are likely to wait for a downside break of the previous month’s high, near 0.7170, to take fresh entry.
Even so, 200-DMA and previous resistance line from February, respectively around 0.7100 and 0.7075, question NZD/USD declines.
On the contrary, a daily closing past 61.8% Fibo. of 0.7213 will head towards May’s top near 0.7315-20.
During the anticipated rally, RSI may play its role to portray intermediate pullbacks near 0.7280 and the 0.7300 levels.
NZD/USD: Daily chart
Trend: Pullback expected


