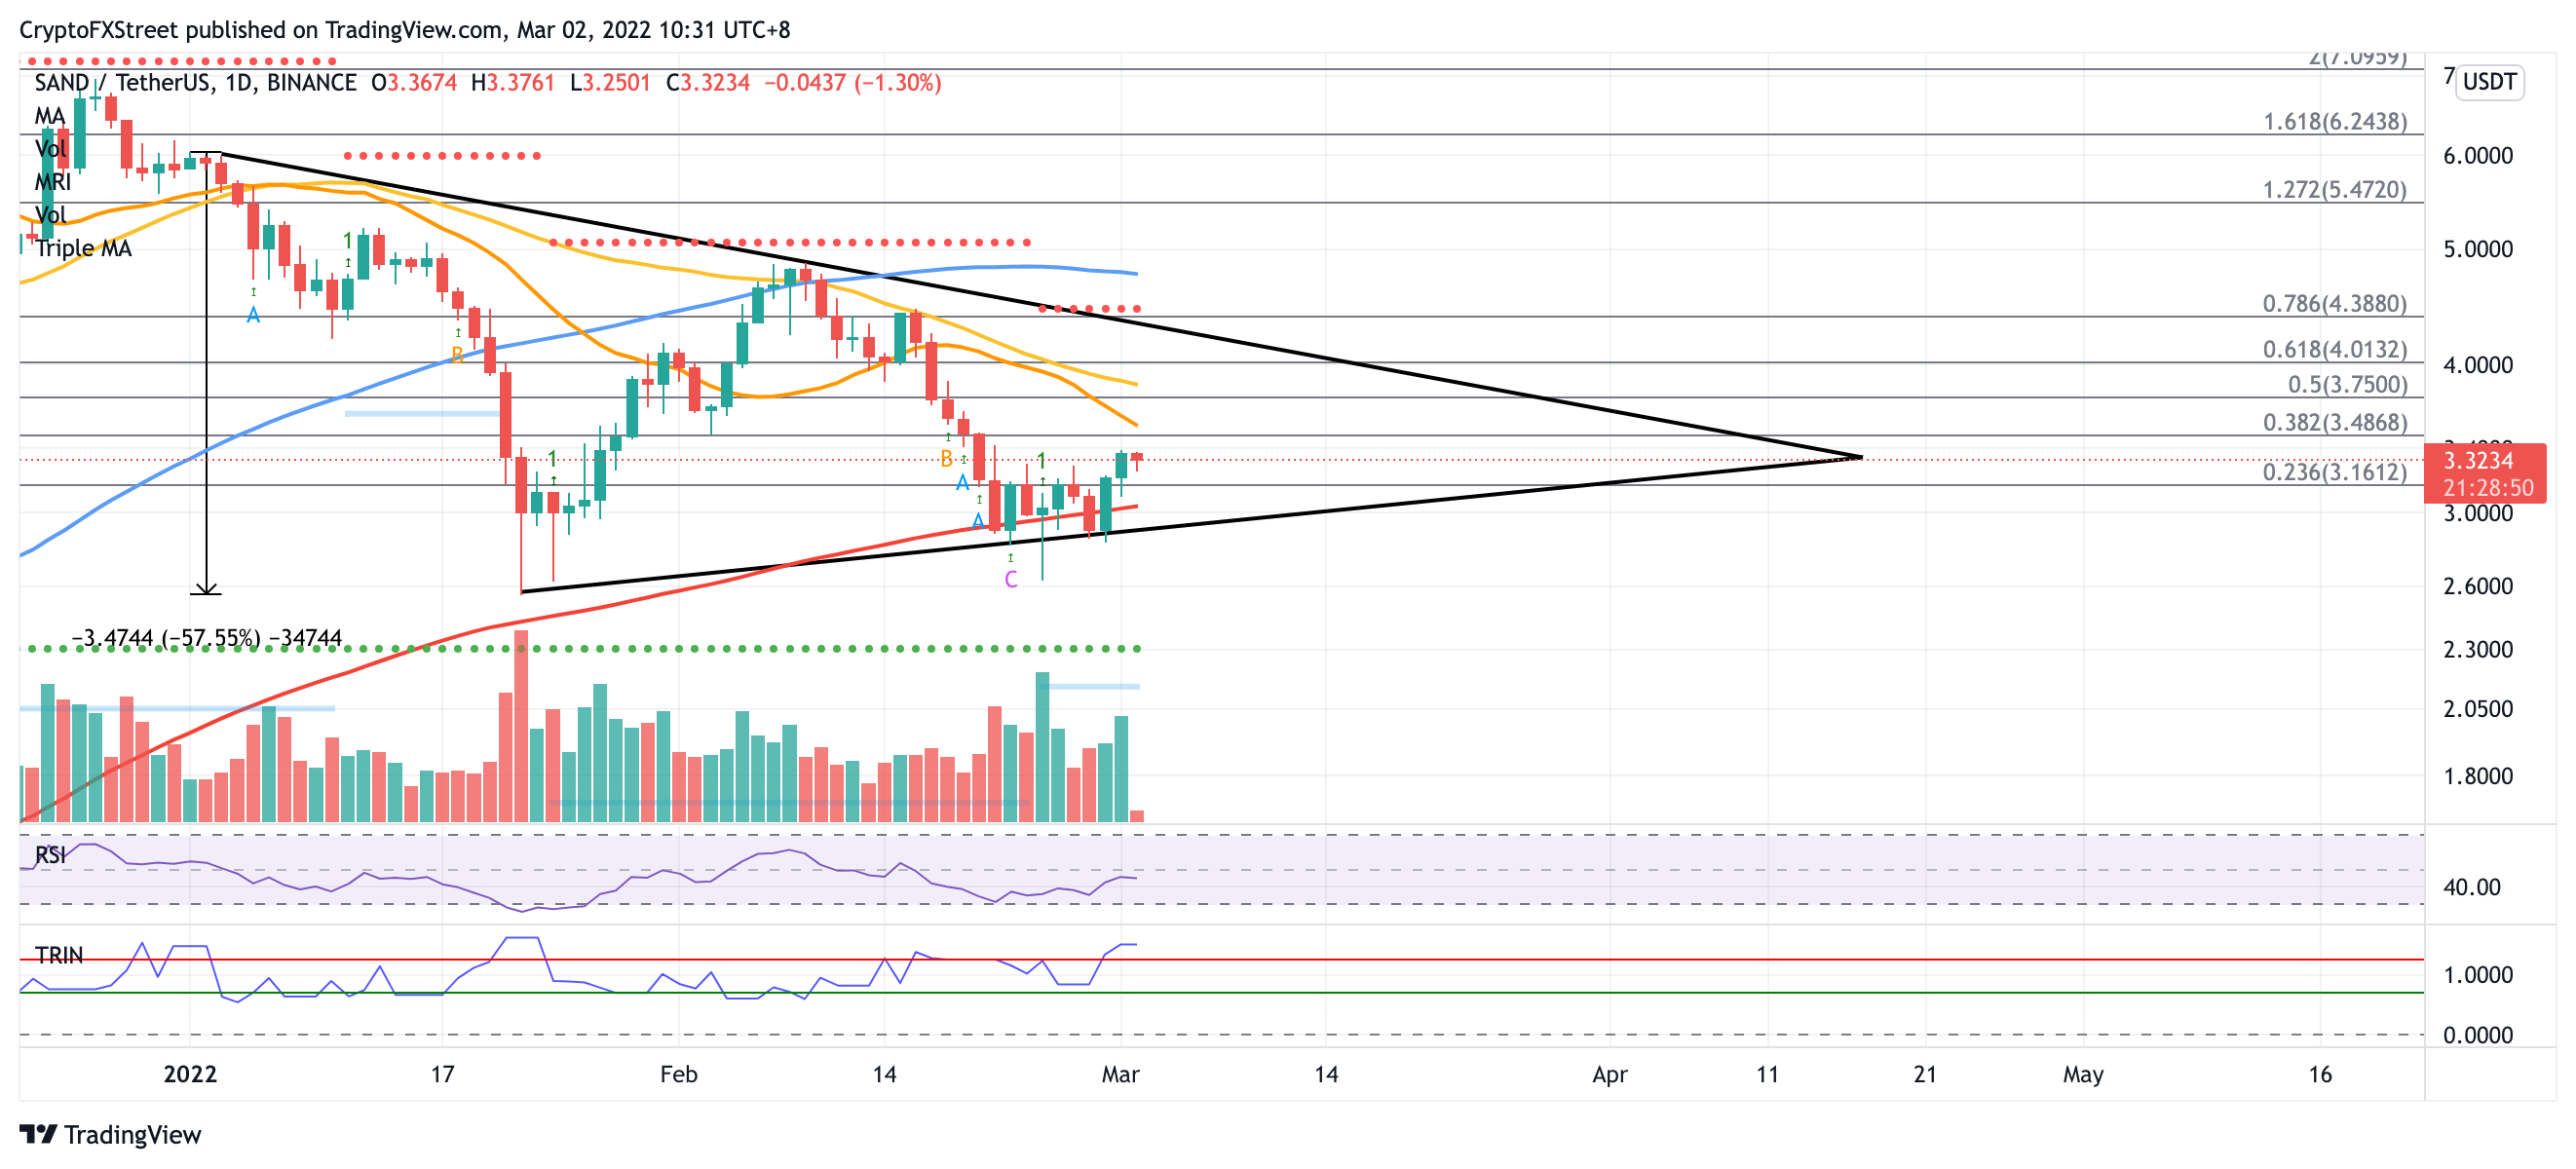
- Sandbox price is preparing for a bullish reversal toward $4.01, tagging the upper boundary of the governing technical pattern.
- However, SAND will face multiple tough challenges ahead before reaching the optimistic target.
- Slicing above the topside trend line of the prevailing chart pattern will put another 57% ascent on the radar.
Sandbox price is headed for an upswing toward the upper boundary of the prevailing chart pattern. However, SAND may continue to consolidate within the governing technical pattern and confuse forecasts until a decisive break occurs.
Sandbox price faces multiple hurdles ahead
Sandbox price has created a symmetrical triangle pattern on the daily chart, as SAND continues to move sideways. Despite the prevailing consolidation pattern, the token may aim to tag the upper boundary of the governing technical pattern at $4.01 next.
Sandbox price will face immediate resistance at the 21-day Simple Moving Average (SMA) at $3.54. An additional hurdle may emerge at the 50-day SMA at $3.85 before SAND reaches the optimistic target, resulting in a 21% climb toward $4.01, coinciding with the 61.8% Fibonacci retracement level.
Investors should note that if Sandbox price manages to slice above the topside trend line of the governing technical pattern, an additional 57% climb toward $6.24 would be put on the radar.
However, bigger aspirations may first target the 78.6% Fibonacci retracement level next at $4.38, intersecting with the resistance line given by the Momentum Reversal Indicator (MRI).

SAND/USDT daily chart
Sandbox price will face additional resistance at the 100-day SMA at $4.80, then at the 127.2% Fibonacci extension level at $5.47.
However, if bearish sentiment increases, Sandbox price could fall toward the 23.6% Fibonacci retracement level at $3.16.
An increase in selling pressure could push Sandbox price lower toward the 200-day SMA at $3.03 before dropping toward the lower boundary of the prevailing chart pattern at $2.83.
Sandbox price could collapse toward the support line given by the MRI at $2.31 if a spike in sell orders occurs.


