
- Stellar Lumens price is showing bearish divergence on the 12-Hour Chart.
- XLM has strong Fibonacci retracement levels up to 18% below the current price.
- An invalidation will be a settlement candle above $0.26
Stellar Lumens price shows strong signals of up to an 18% pull back from the current price of $0.23. Traders should consider securing profits.
Stellar Lumens price correction is likely to occur
Stellar Lumens price has accomplished a 40% bull rally during March. XLM enthusiasts looking at other outperforming cryptocurrencies in the market are likely questioning when their investment will mimic similar price action. Unfortunately, that hopeful day may not be coming anytime soon for the XLM price as the bulls are showing signs of exhaustion.
Stellar Lumens price shows hidden bearish divergence on the Relative Strength Index. The recent highs printed into $0.24 are being presented as more oversold than the $0.25 swing high in February. Additionally, XLM price has failed to establish a higher closing candle than the previous swing high thus far.
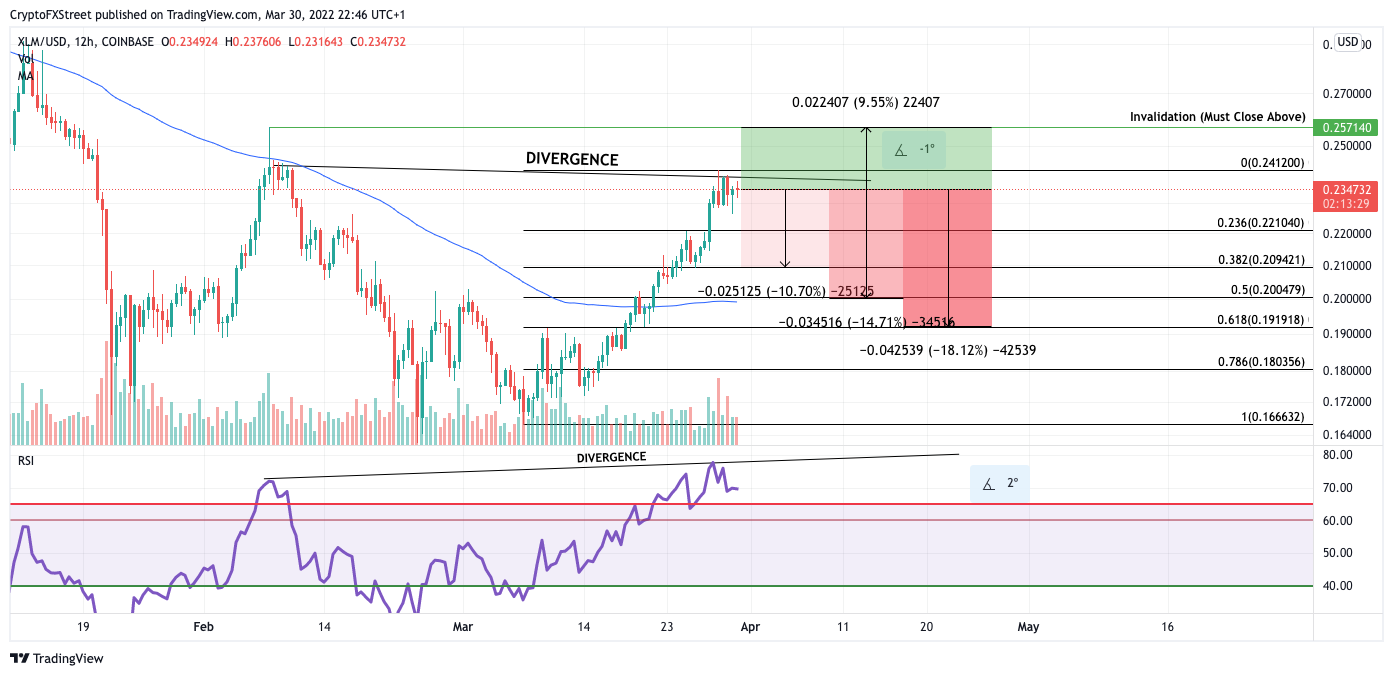
XLM/USD 12-Hour Chart
A Fibonacci retracement indicator surrounding the 40% rally has three strong targets below at the 38.2%, 50% and 61.8% levels. The 50-Day moving average hovers 14% below the 50% Fibonacci level at $0.20. At maximum, the XLM price could fall into the 61.8% level at $0.19, resulting in an 18% pull back from the current Stellar Lumens price.
An invalidation for the bearish thesis will be a settling price above February's swing high at $0.26. If this were to occur, the bulls would likely have enough strength to tap liquidity above the $0.28 and $0.30 levels, resulting in a 30% increase from the current Stellar Lumens price.


