
- Shiba Inu is testing a technical line that could spell trouble for the rest of the week.
- SHIB price, once it breaks below the technical line, could be set for a 30% drop.
- Expect a bounce off the descending trend line and a swing back to $0.001000.
Shiba Inu (SHIB) price is under pressure as the token racks up its seventh day of losses – assuming SHIB price does not close above $0.00000859 this evening. To make matters worse, a daily close below a key technical line could bring even more downside risk by increasing the power of bear's hold over price action. Expect this Monday to be crucial for SHIB price action for the rest of the week, with both a 30% drop and a 20% pop potentially on the cards.
SHIB price under siege from the dollar hurricane
Shiba Inu price is in distress after a bloody weekend with traders seeing little silver lining from the previous week’s price action. Given the lack of attractive entry levels in sight, no firm trading plans put forward and the significant inflation headwind not losing strength, it looks like this week will be a repetition of the same scenario of last week. The biggest bogeyman for global markets seems to be ferocious dollar strength, which is grabbing financial markets by the scruff of the neck and keeping investors sidelined for the moment.
SHIB price is at a critical juncture with a fresh can of losses set to be opened if price closes below the red descending trend line tonight. In such a case, another leg lower would be on the cards towards $0.00000600 with the monthly S1 support level and the low of last year nearby. Considering seasonality – with the summer lull just around the corner and the yearly September sell-off also not far – a possible cryptocurrency rally does not look likely, and another 30% drop the more realistic scenario.
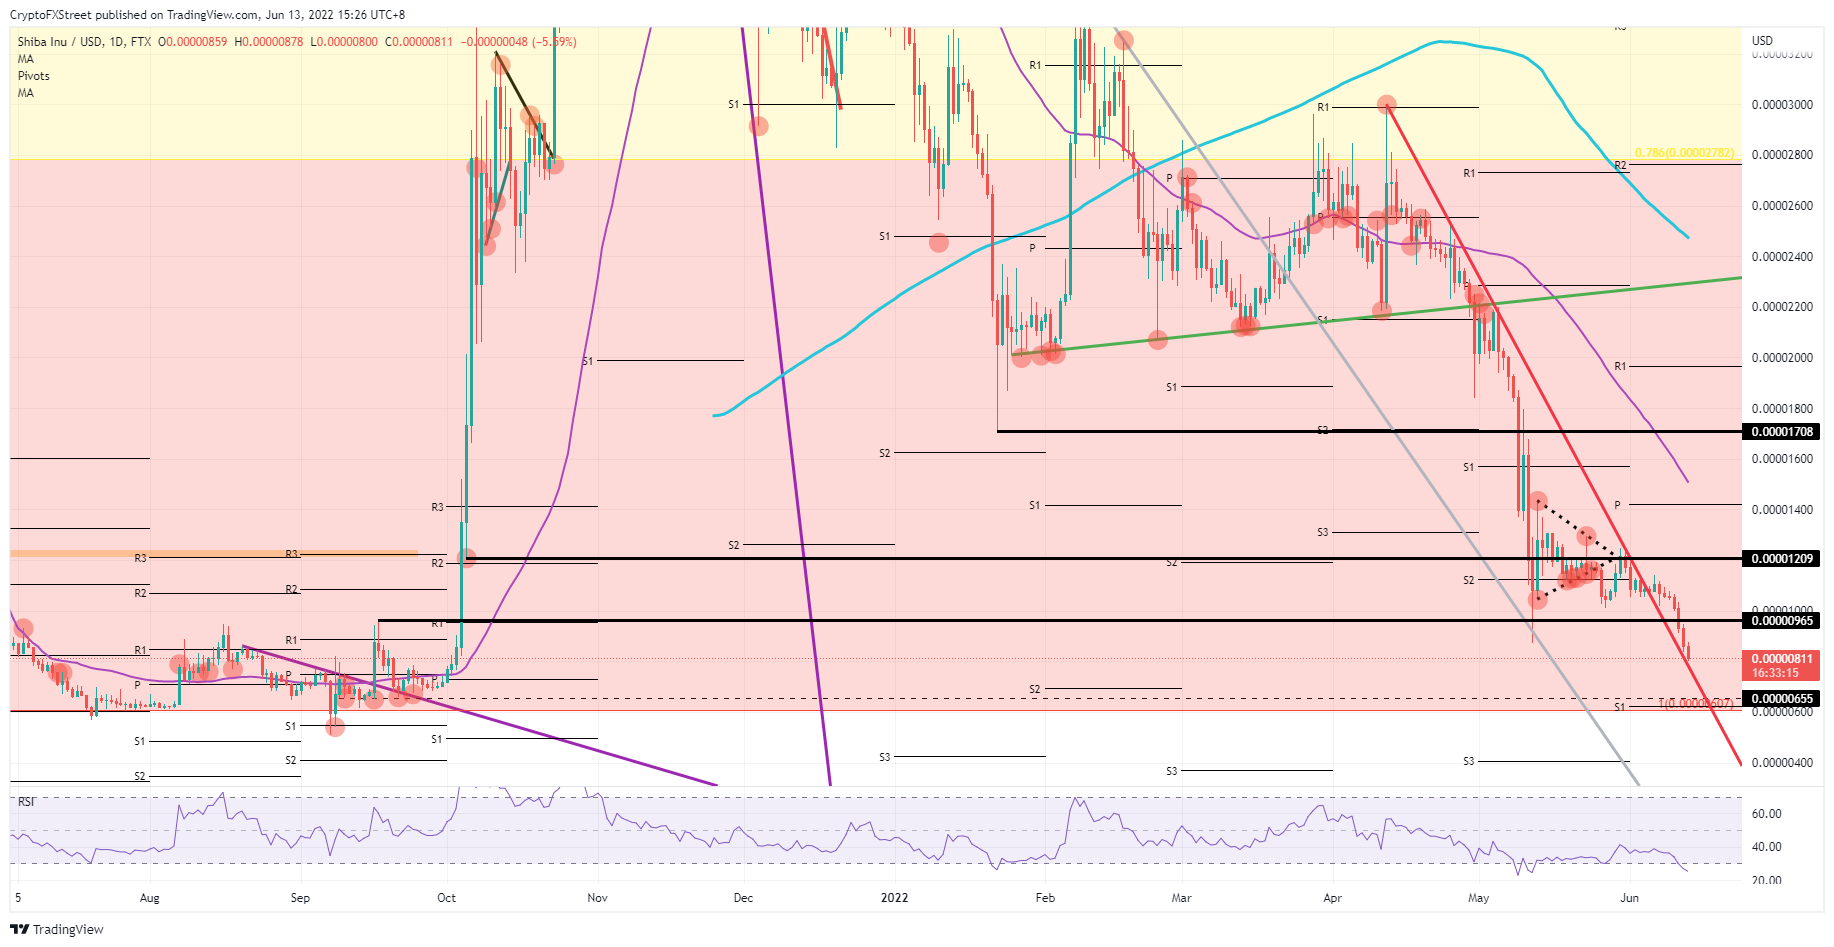
SHIB/USD daily chart
If SHIB can close above the red descending trend line, however, all hope will not be lost, and a retrace back to $0.00001000 may still be possible. From a purely technical perspective, that would fit with a retest and bounce off that same red descending trend line. The Relative Strength Index (RSI) is also supporting such a recovery given it is trading in oversold. This could make up some of the incurred losses from Sunday. Depending on the trading week, a possible unwind of dollar strength could open up some more room to the upside to possibly even $0.00001209.


