- Ethereum price is at the edge of falling another 10% as bearish momentum grows.
- There is an increase of sellers in the market, as the bears target $2,853 next.
- Sliding below $3,164 could spell trouble for the bulls.
Ethereum price could be at risk of falling further following a break of a significant support trend line. ETH is on the verge of sliding 10% toward $2,853 if selling pressure increases and a reliable foothold is not found.
Ethereum price prepares for deep plunge
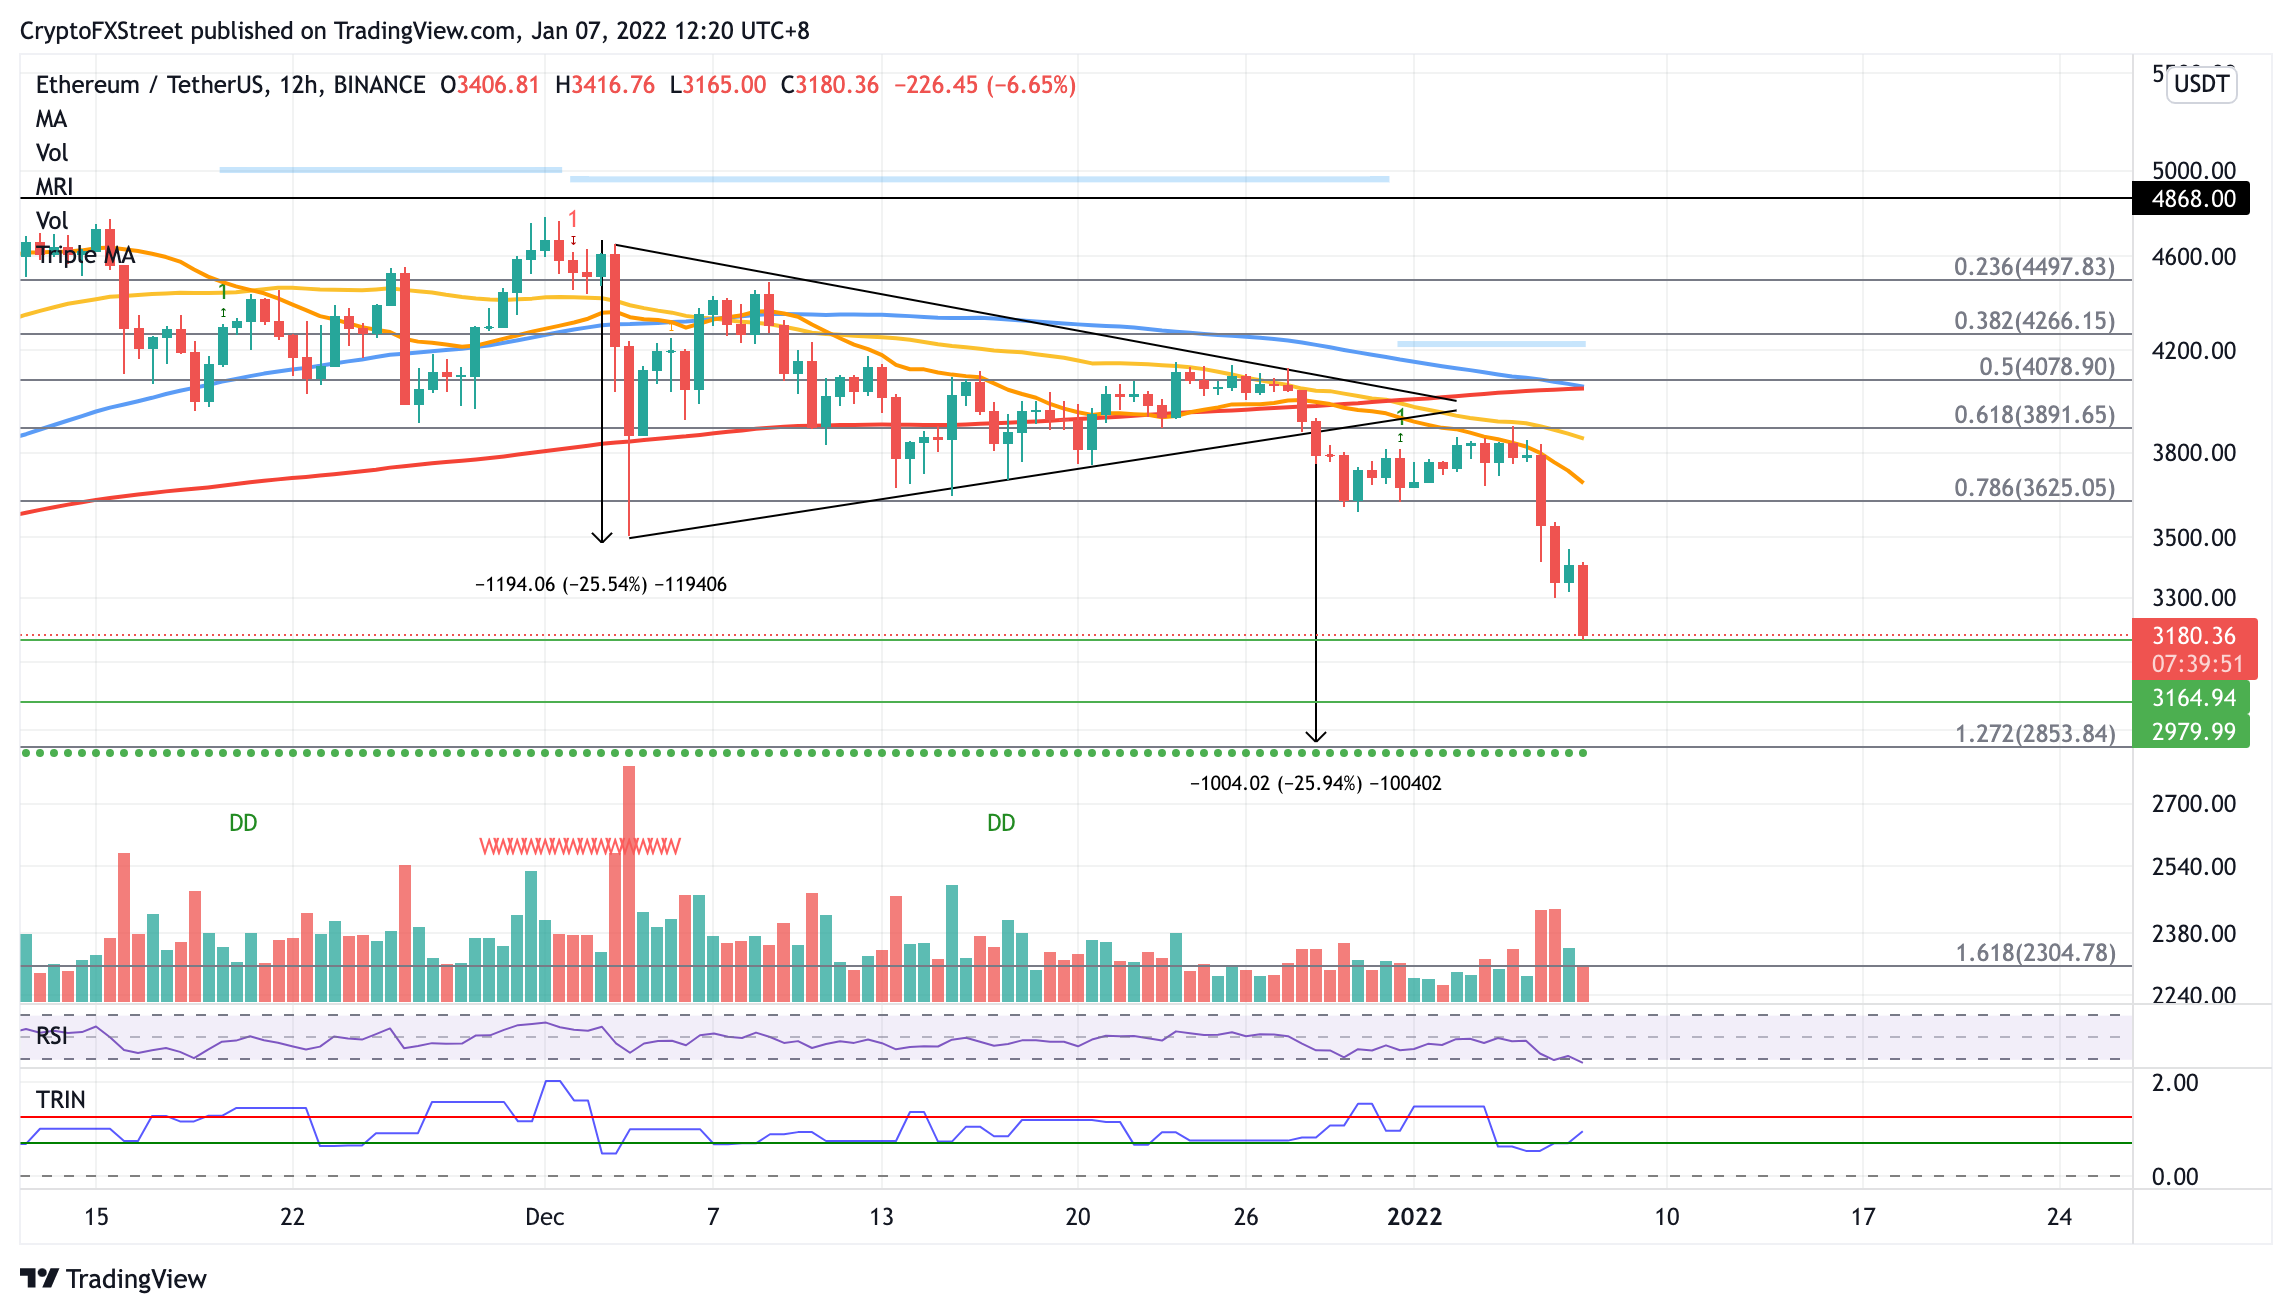
Ethereum price has sliced below the lower boundary of the symmetrical triangle on the 12-hour chart, suggesting a bearish outlook. The measured move given by the prevailing chart pattern is a 25% drop toward $2,853. ETH is already halfway to meeting its pessimistic target.
Unfortunately, there does not seem to be an abundance of reliable lines of defense for Ethereum price. The first foothold will appear at the September 26 high at $3,164, then at the September 24 high at $2,979.
However, if the aforementioned levels fail to hold, Ethereum price could be at risk of meeting the bearish target at $2,853, coinciding with the support line given by the Momentum Reversal Indicator (MRI) and the 127.2% Fibonacci extension level.
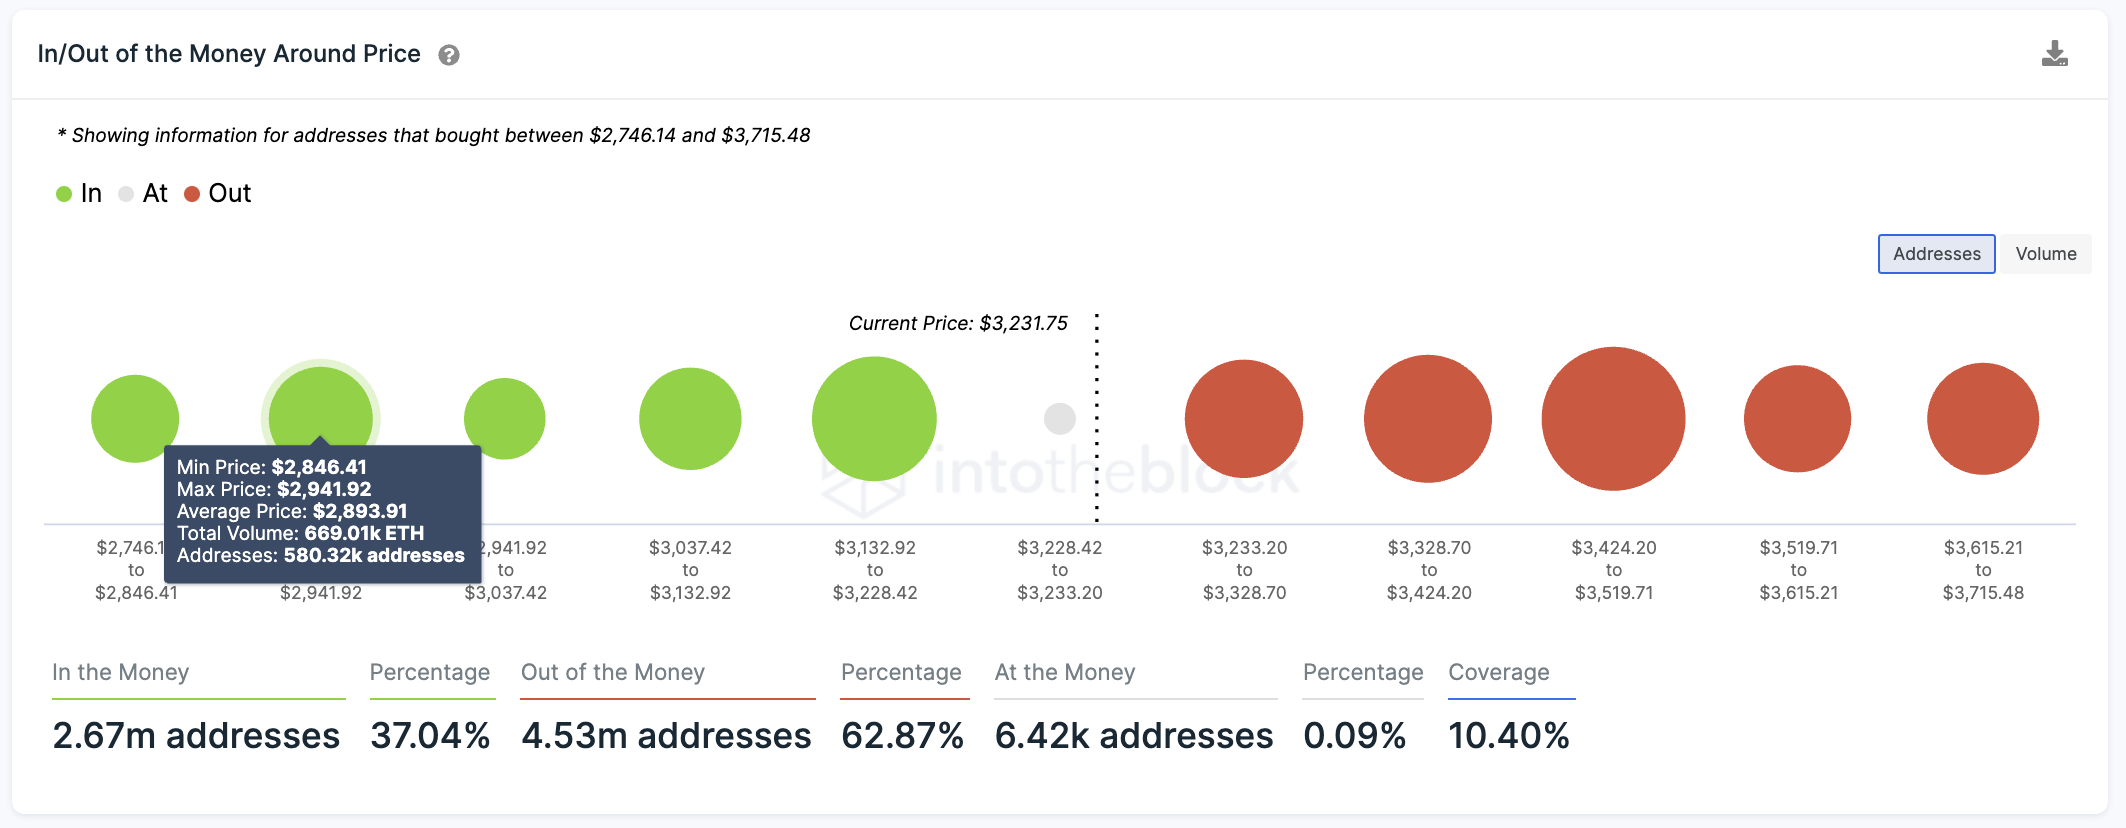
IntotheBlock’s In/Out of Money Around Price (IOMAP) model indicates that the first line of defense for Ethereum price is located near the largest cluster of buyers in the money of 952,000 addresses who purchased 792,000 ETH at an average price of $3,175.

ETH IOMAP
However, if ETH loses the aforementioned foothold, the next largest cluster of buyers, with 580,000 addresses having purchased 669,000 ETH at an average price of $2,893, indicates that this area is the next strongest area of support.
In addition, the Arms Index (TRIN) which gauges overall market sentiment suggests that there is an uptick of sellers in the market, indicating some investors panicking, leading to a panic sell-off.

ETH/USDT 12-hour chart
However, if the bulls manage to reverse the period of underperformance, The first area of resistance may appear at the 78.6% Fibonacci retracement level at $3,625. Additional headwinds may emerge at the 21 twelve-hour Simple Moving Average (SMA) at $3,697, then at the 61.8% Fibonacci retracement level at $3,891, coinciding with the 50 twelve-hour SMA.


