
- Bitcoin price wavers at the 50% retracement level at $46,849 as underlying momentum continues to weaken.
- Ethereum price trying to hold the July trend line as a bearish momentum divergence accompanies recent highs.
- XRP price strength lifts the daily Relative Strength Index (RSI) to the most overbought reading since April high.
Bitcoin price and Ethereum meet transition points for the July rally as pivotal Fibonacci levels emerge as formidable resistance. XRP price pauses, but it probably will not be for long.
Bitcoin price has reached a minor inflection point
Bitcoin price closed last week with its fourth consecutive weekly gain, marking the first time since February and lifting BTC to an August gain of 11.48% and 32.14% for Q3. It is the best August performance since the August 2017 gain of 66.05% and the best third-quarter return since the 76.73% rise in Q32017.
However, the momentum has declined measurably since the August 7 close, just below the 200-day simple moving average (SMA) at $44,637. Over the last nine trading days, Bitcoin price has rallied only 3.61%, carrying BTC to new highs but forging a bearish momentum divergence as the RSI has not confirmed the price highs on various timeframes.
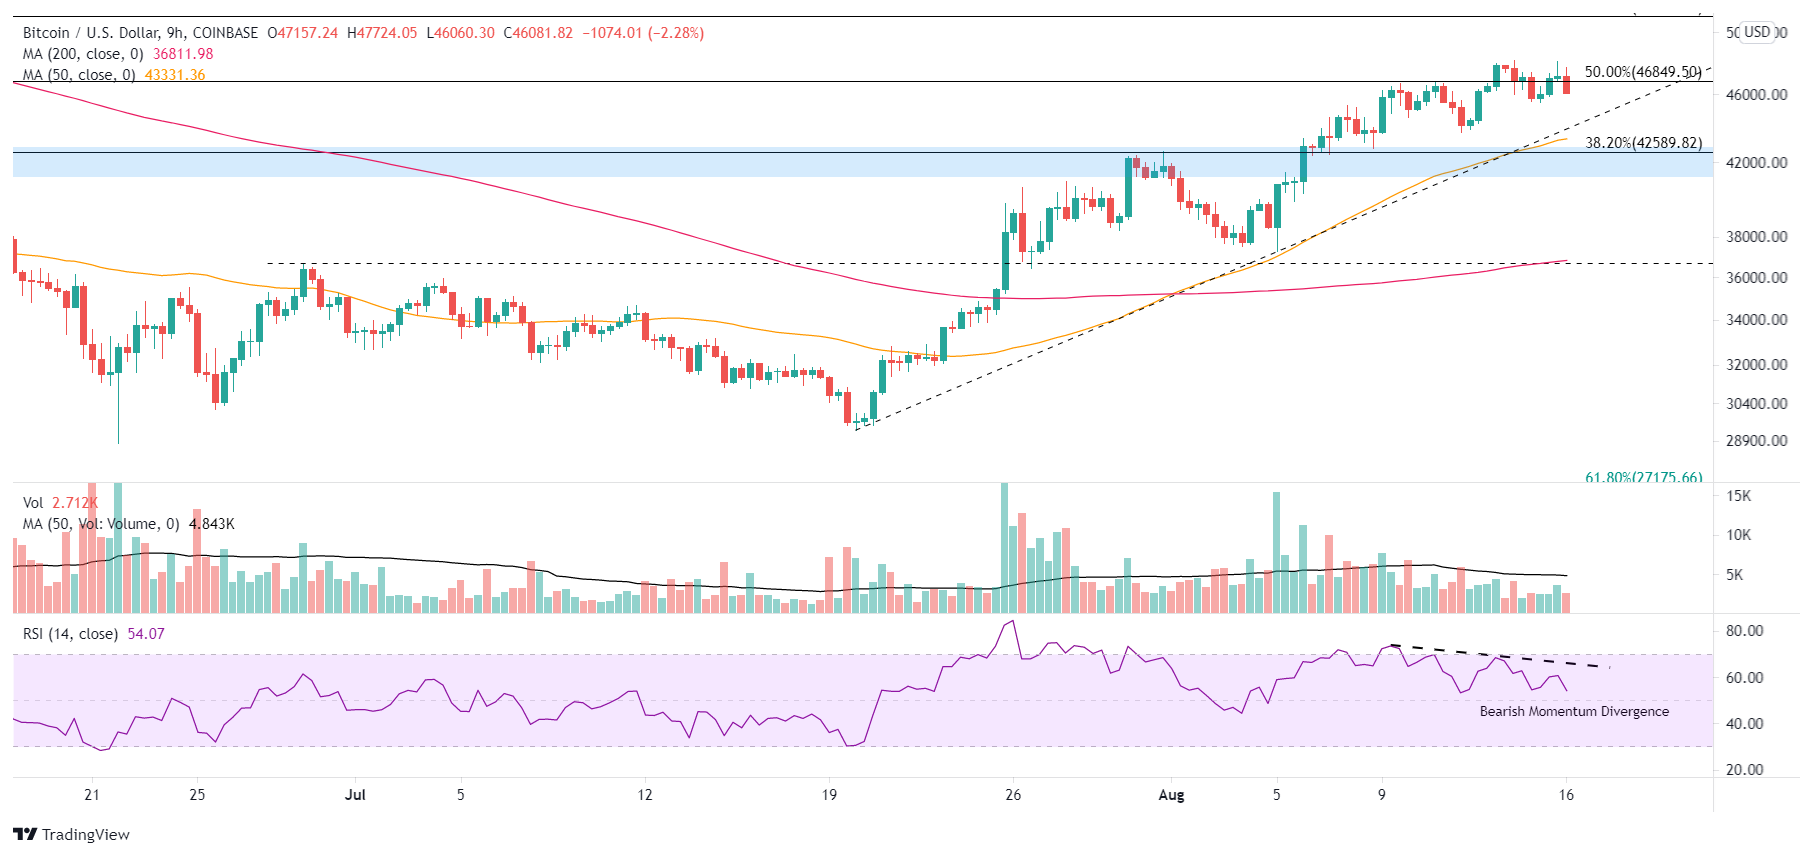
BTC/USD 9-hour chart
The bearish momentum divergence does put the July rally at risk in the short term. It raises the probability that BTC will test the previous trifecta of resistance (now support) between $41,500 and $43,000, including the 38.2% retracement of the April-July correction, yielding an 11% correction from the current price.
If a BTC correction gains traction below the trifecta of support, Bitcoin price will not encounter support until the 50-day SMA at $37,446, which currently rests close to the critical June 29 high of $35,301.
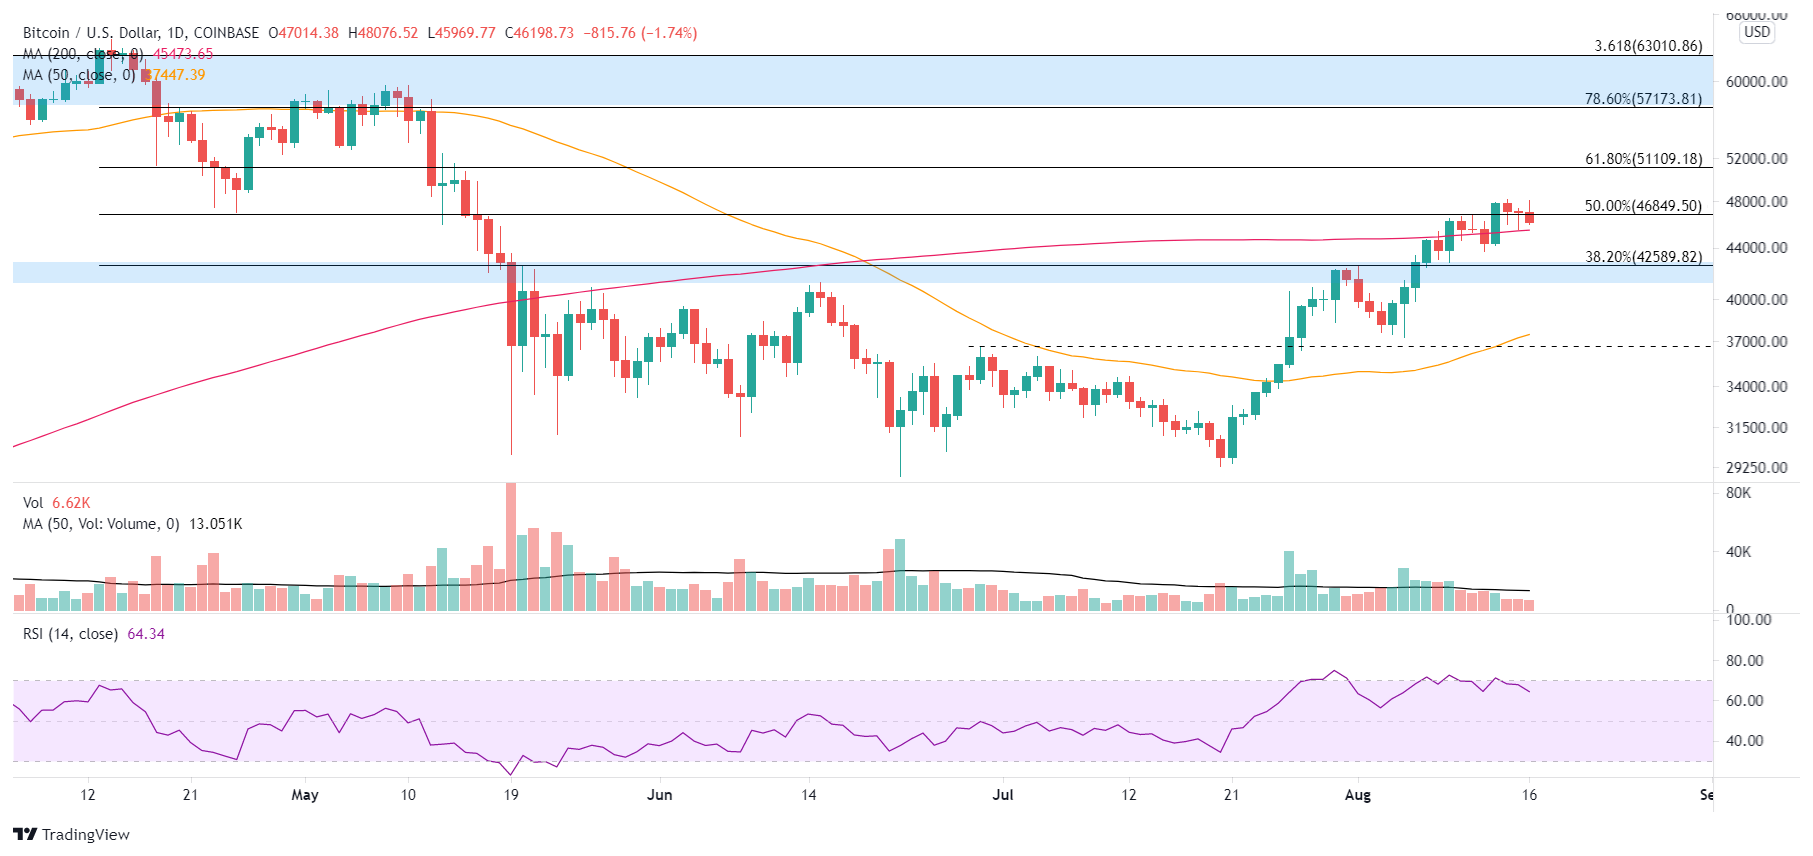
BTC/USD daily chart
The potential for a deeper pullback is higher than a week ago, but due to the assortment of support, including the 200-day SMA at $45,473 and the 38.2% retracement at $42,589, Bitcoin price weakness could be well-contained and lead to a correction in time versus price. It would still reconcile the bearish momentum divergence, create an additional entry price for latecomers and remove the weaker holders.
As a result of the slowing Bitcoin price momentum and the broadening of the altcoin participation in the general upswing in the cryptocurrency complex, the BTC market dominance has broken the May uptrend. It is now correcting, currently at 44.15%. It does not warn of a pending collapse for the bellwether cryptocurrency but a correction.
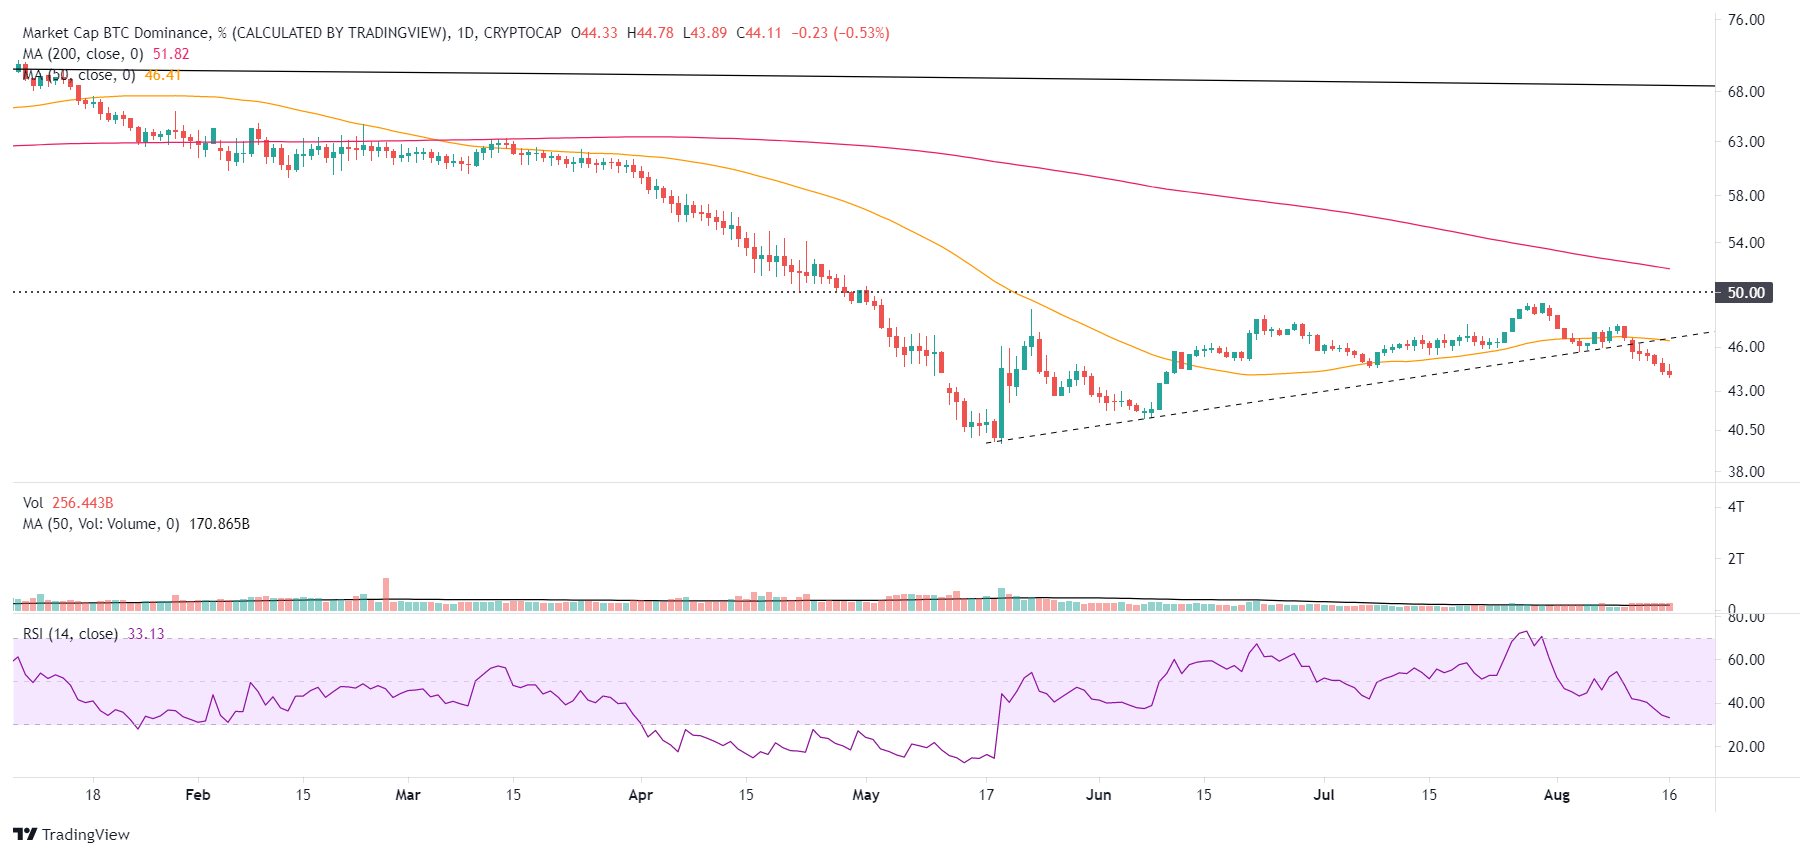
BTC/USD market dominance – daily chart
Here, FXStreet's analysts evaluate where BTC could be heading next as it looks primed to retrace.


