
- USD/JPY is in the throes of completing a -272% Fibo to 112.40
- W-formation is a risk for bulls seeking 2018 levels near 112.90.
USD/JPY has been climbing into fresh bullish territory in October, surpassing the September highs and now meeting the Feb 2020 high of 112.23. However, on the way there, the market has left a compelling reversion pattern on the daily chart which could anchor the pair before it can take on the 112.40-112.90 territory. The following illustrates the chart pattern and structure.
USD/JPY daily chart
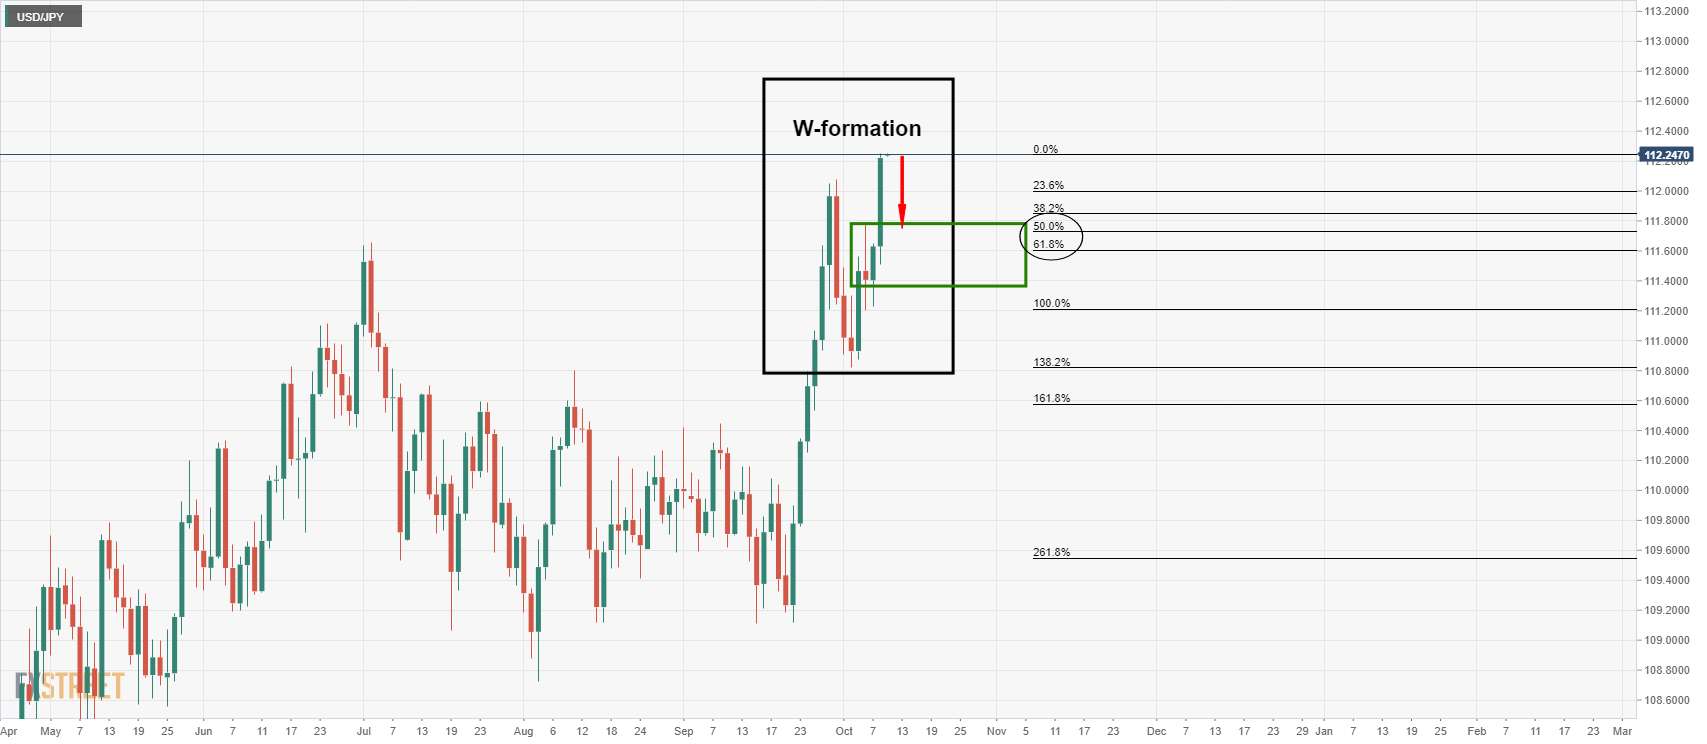
The price would be expected to revert to at least the mean of the bullish impulse where it has a confluence with the neckline of the W-formation.
USD/JPY weekly chart
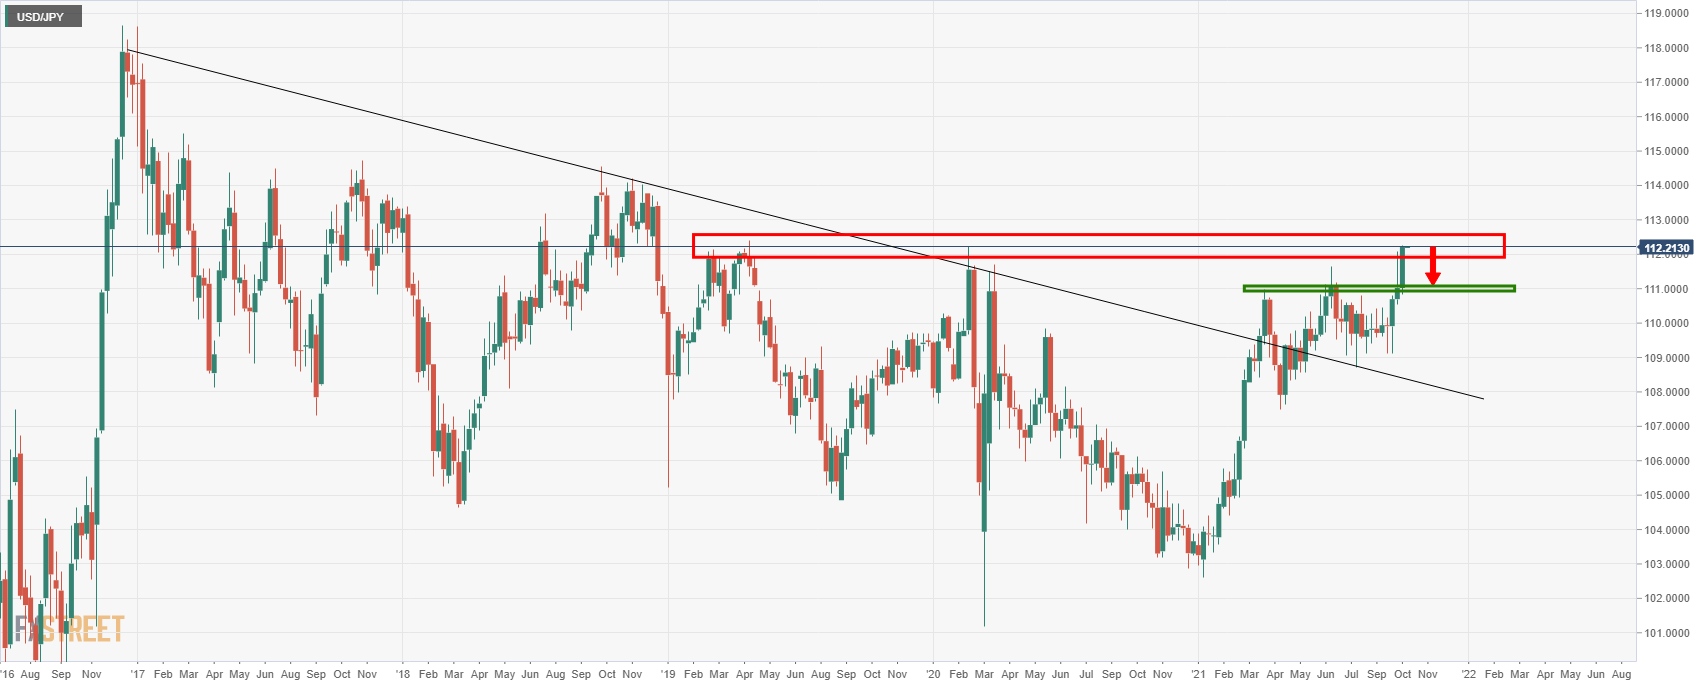
The price is meeting weekly resistance at this juncture and would be expected to struggle and revert, potentially as low as 111 the figure to test prior structure.


