
- SafeMoon price is stuck between a rock and a hard place.
- SFM price sees several bullish and bearish technical elements keeping price action gripped.
- Expect to see further consolidation with a price breakout going into next week.
SafeMoon (SFM) price is still respecting several technical elements that are determining the price action for most of June and July for now. On the one hand, the orange descending trend line is still very much pressing on any attempts of bulls to break higher, while the green ascending trend line underpins SFM price action with a slow grind higher. Buyers and sellers are getting pushed toward each other, and a breakout could happen anytime now.
SFM price set for a bearish breakout
SafeMoon price has seen a rejection of the bulls’ attempt to break above the orange descending trend line, as price has taken a dip and looks set to break below the low of Thursday. In a small area, the road looks open for a price drop back to the base supportive green ascending trend line. In this narrow price range, bears and bulls are getting squeezed towards each other, set for consolidation and a breakout.
SFM price will break below the green ascending trend line towards the black baseline at $0.0003842. A bearish triangle can be identified with the orange and red descending trend line, providing reasoning on why the breakout would fall in favor of the bears. Should that $0.0003842 give way, expect a massive nosedive move of 30% towards $0.0002716.
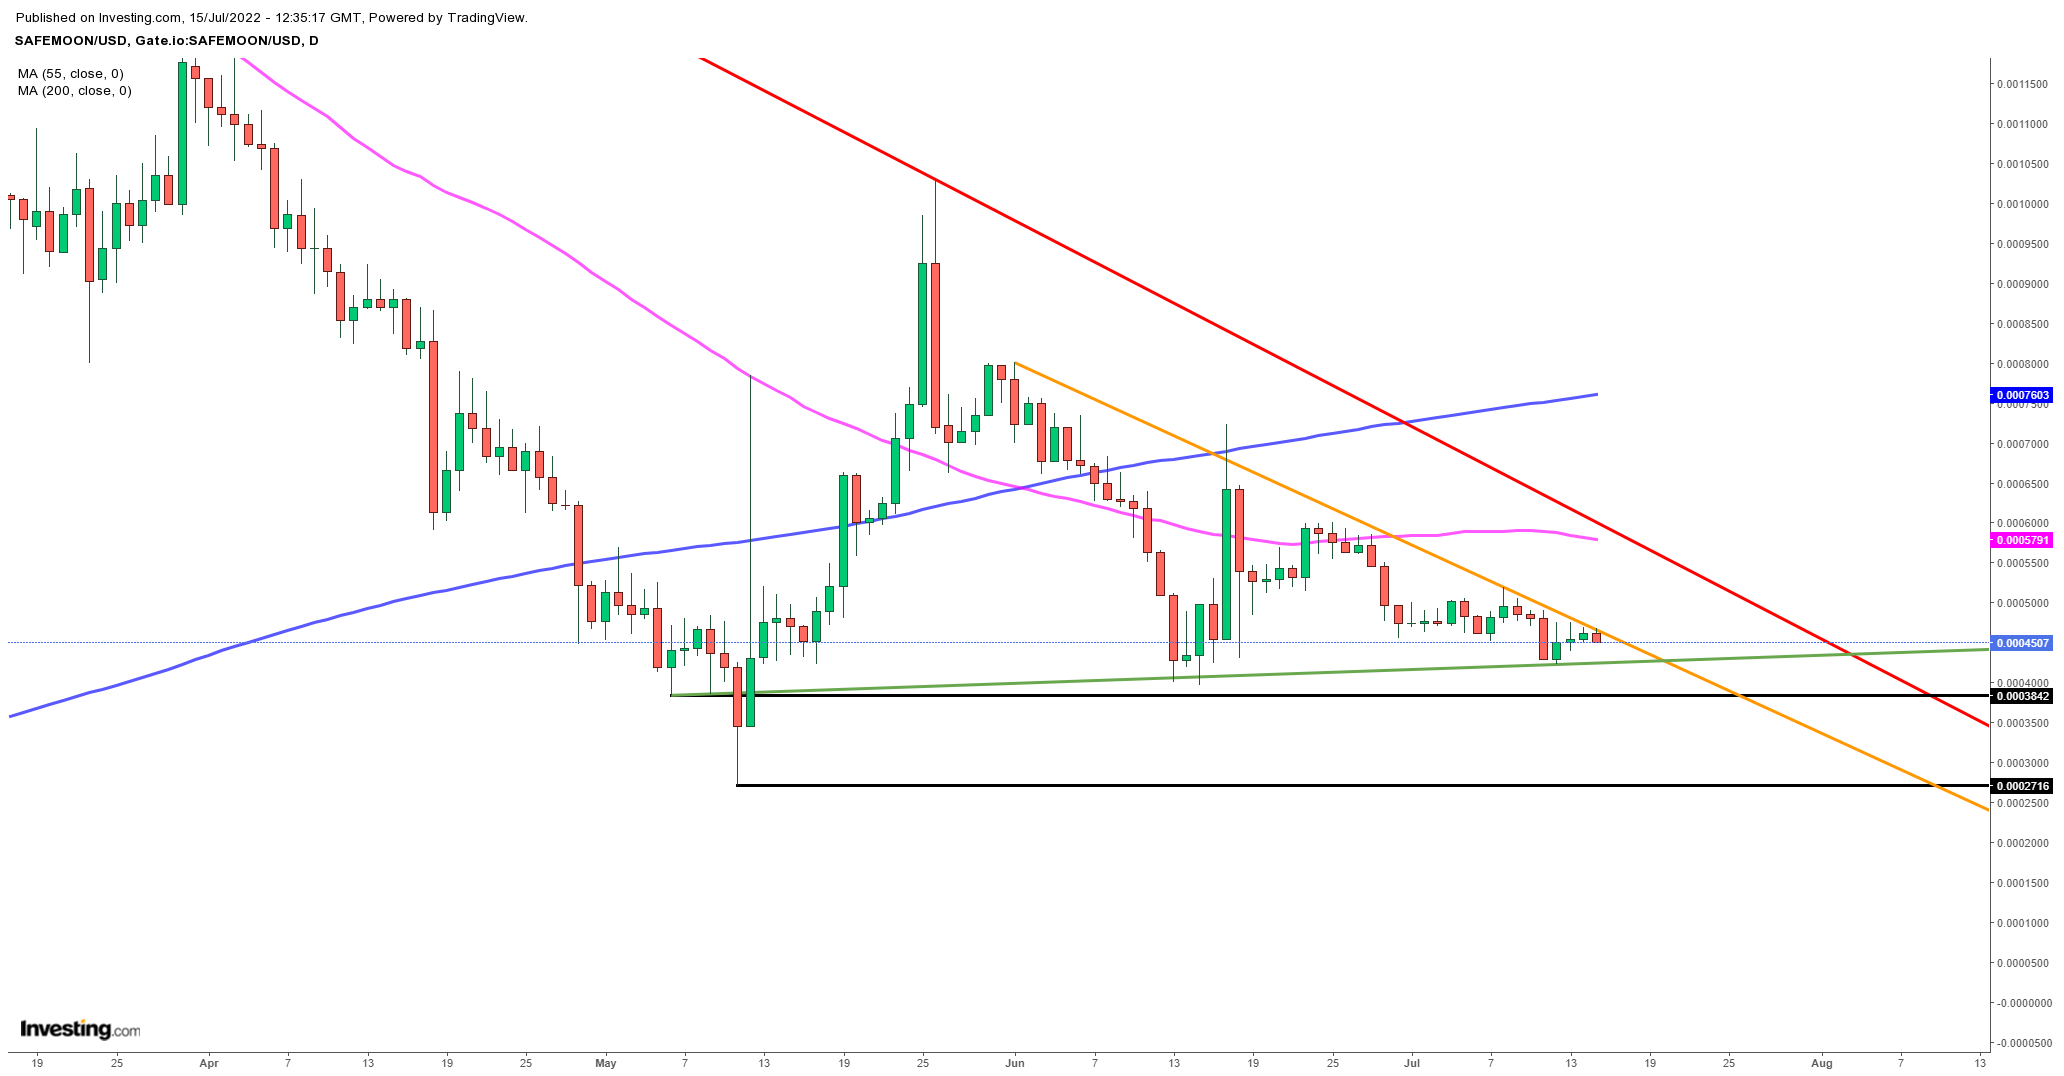
SFM/USD Daily chart
An upside break would need a catalyst to trigger an explosion in the buy-side volume needed to lift SFM price action up. That catalyst could come from a weekly gain in equities or a sigh of relief on the back of positive development in geopolitics. That would see a massive rally towards $0.0005791 and bear 20% of gains to traders that jump on the break above the orange ascending trend line.


