
- Tezos price action has formed an ascending triangle, hinting at a bullish outlook.
- However, considering the bearish backdrop, investors can expect a bearish breakout.
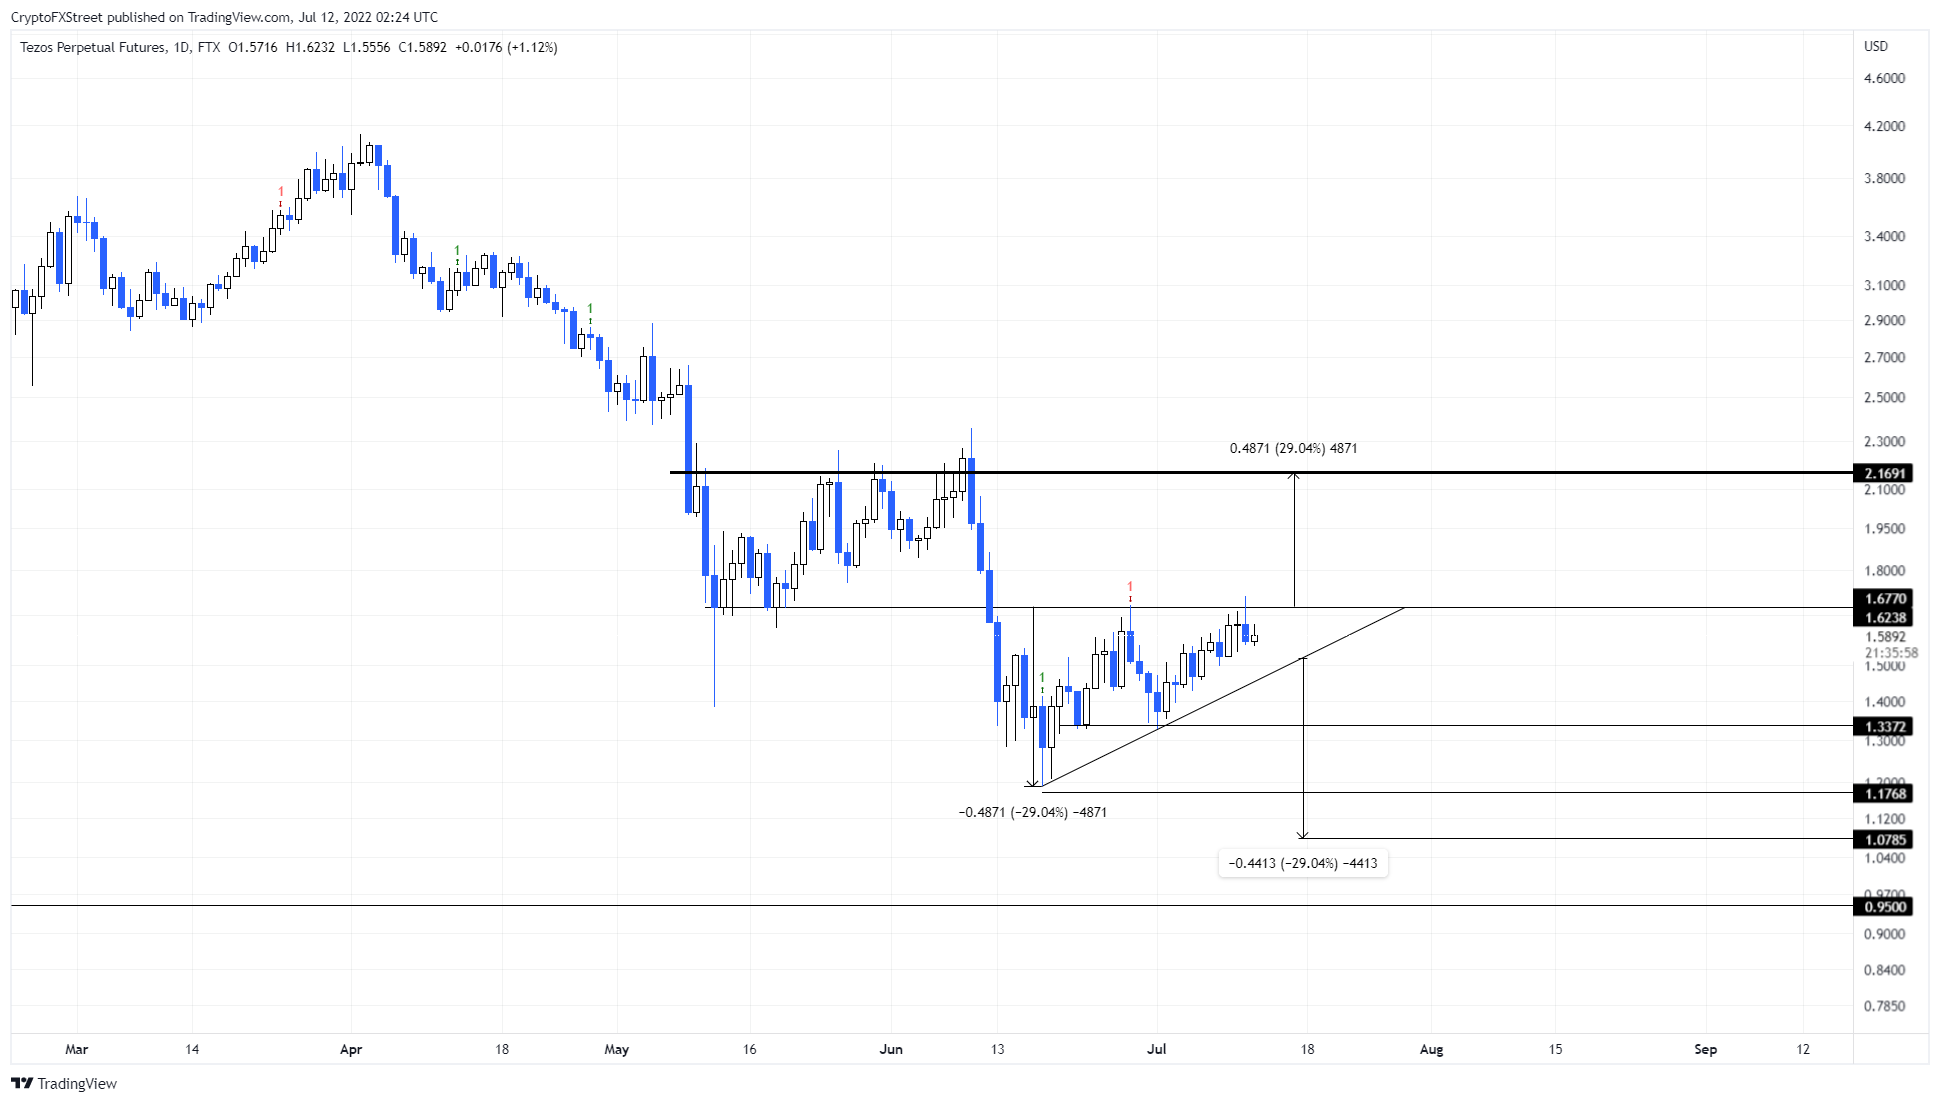
- A decisive daily candlestick close below $1.33 could trigger a 29% crash to $1.07.
Tezos price continues to consolidate under a high-time-frame resistance barrier that has prevented any upside for roughly a month. The recent recovery lead to a failed attempt at breaking out, suggesting that the sellers are still present.
Tezos price and the bears move together
Tezos price witnessed a sell-off on June 12 that pushed it below the $1.67 support level. After this breakdown, XTZ lost 29% of its value before forming a stable bottom around $1.17 on June 18.
Many altcoins underwent a similar bearish move up to June 18 but kick-started a run-up after this point. As a result, Tezos price bounced 41% to retest the $1.67 hurdle again. Between June 18 and July 12, XTZ produced two equal highs and two higher lows.
Going forward, investors can expect another leg down. Regardless, if the bearish momentum continues to tug, XTZ price is more than likely to trigger a bearish breakout. In such a case, Tezos could produce a daily candlestick close below $1.33, which will signal a downward breakout.
In such a case, the target of $1.07 for the ascending triangle is obtained by measuring the distance between the first swing high and swing low to the breakout point at $1.33.
XTZ/USDT 1-day chart
On the other hand, if Tezos price produces a premature breakout above the $1.67 barrier and flips it into a support level, it will invalidate the bearish thesis.
In such a case, based on the measurement rule, XTZ price could trigger a 29% run-up to $2.16.


