
- AUD/USD fades bounce off two-month low, grinds lower.
- Bearish MACD signals, sustained break of key support line favor sellers.
- RSI conditions, key technical support challenge further downside.
- Bulls remain away below monthly resistance line, 61.8% Fibonacci retracement adds to the upside filters.
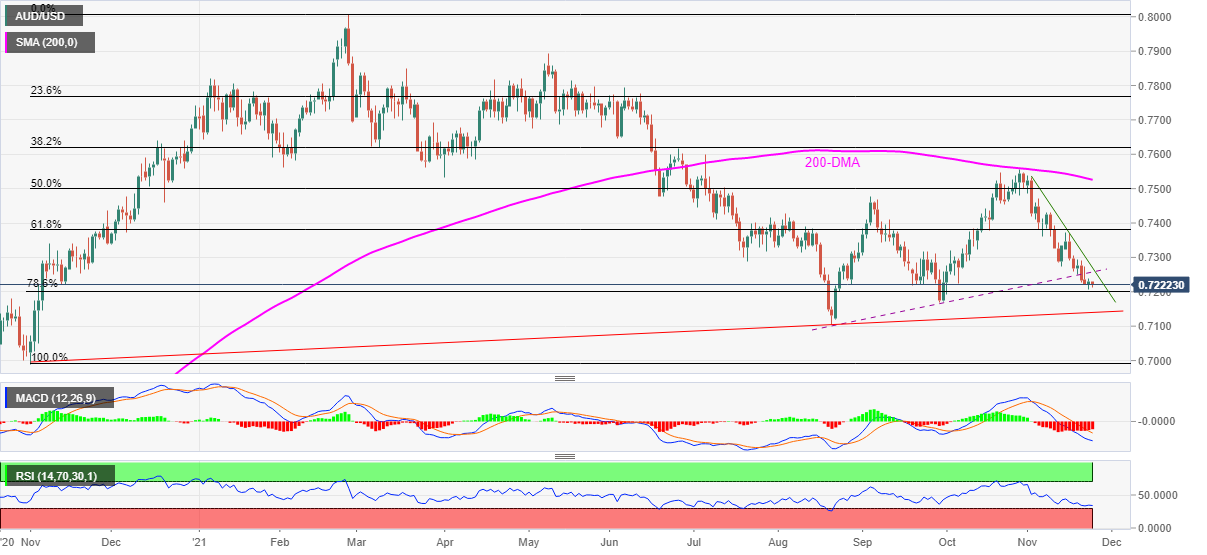
AUD/USD stays depressed around the September lows, sidelined near 0.7220 during early Wednesday.
In doing so, the Aussie pair aims for the 78.6% Fibonacci retracement (Fibo.) of November 2020 to February 2021 upside, around 0.7200 amid bearish MACD signals and a clear downside break of the three-month-old ascending trend line.
It should be noted, however, that nearly oversold RSI conditions may challenge the AUD/USD sellers past 0.7200, a break of which highlights October’s low and a yearly support line, respectively near 0.7170 and 0.7140, for the pair nears.
In a case where the quote remains bearish past 0.7140, the 2021 bottom of 0.7105 will be in focus.
Alternatively, a corrective pullback should not only offer a daily closing beyond the previous support line from August, close to 0.7260, but also successfully cross a downward sloping resistance line from November 02, around 0.7295, to convince the AUD/USD bull’s return.
Following that, the 61.8% Fibo. level near 0.7360 should gain the market’s attention.
AUD/USD: Daily chart
Trend: Further weakness expected


