
- On Thursday, the NZD/USD trimmed Wednesday’s losses, approaching 0.7200.
- Overall, US dollar weakness dents the prospects of the greenback, despite higher US bond yields.
- US GDP for the Q3 was lower than expected shows that the US economy could be slowing.
The NZD/USD advances as the New York session end, is up 0.43%, trading at 0.7198 at the time of writing. Market sentiment is upbeat, portrayed by US equity indices finishing in the green, posting gains between 0.68% and 1.15%. Factors like US corporate earnings have kept investors looking for riskier assets, hurting safe-haven currencies like the US dollar, the Japanese yen, and the Swiss franc.
Furthermore, the US Dollar Index, which tracks the greenback’s performance against a basket of its peers, plummeted 0.71 %, to sit at 93.35, despite higher US Bond yields. In the meantime, the US 10-year benchmark note rose by five basis points, currently at 1.578%.
US GDP for the Q3, lower than expected, as growth seems to be peaking, but inflation not
An absent New Zealand economic docket left the pair’s behavior at the dynamics of the US dollar.
Meanwhile, the US economic docket unveiled mixed data, being the highlights the less than expected growth in the US economy, with the Gross Domestic Product for the third quarter growing 2%, just short of the 2.7% estimated, missing widely against 6.1% growth in the previous period reading. Contrary, the US Initial Jobless Claims rose to 281K, lower than the 290K estimated by analysts, showing the US labor market has been improving throughout the last month.
The NZD/USD traders now will turn their attention to the next week, when the Federal Reserve will unveil its monetary policy decision. Investors already priced in a mid-November bond tapering start, but recent US economic data could push it backward, resulting in US dollar weakness and New Zealand Dollar strength.
NZD/USD Price Forecast: Technical outlook
1-Hour chart
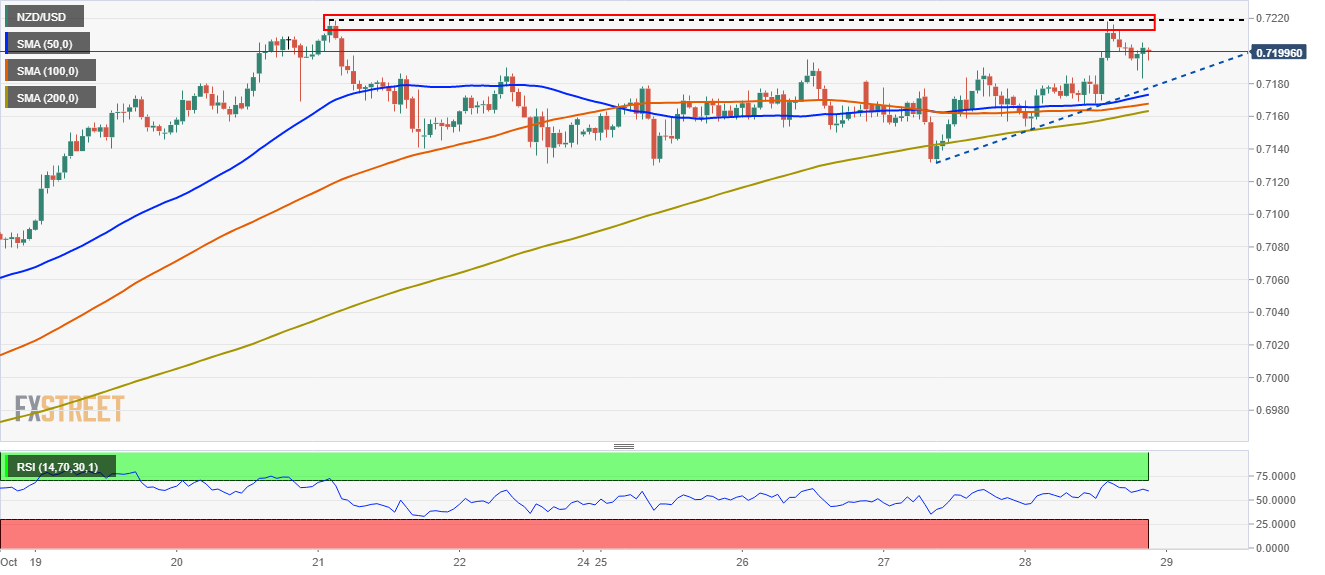
The 1-hour chart depicts the NZD/USD pair is tilted to the upside, with the 50, 100, and 200-simple moving averages (SMA’s) remaining beneath the spot price. Also, a rising upslope trendline that travels from the October 27 low towards the October 28 low would cap any downward move that could threaten to break below the SMA’s.
Furthermore, the Relative Strength Index at 61 aims higher with enough room to support another NZD/USD leg up before turning overbought.
Therefore, a break above the 0.7200 figure is on the cards, but strong resistance would lie on 0.7220, unsuccessfully tested three times before.


